DynaDom: structure-based prediction of T cell receptor inter-domain and T cell receptor-peptide-MHC (class I) association angles
- PMID: 28148269
- PMCID: PMC5289058
- DOI: 10.1186/s12900-016-0071-7
DynaDom: structure-based prediction of T cell receptor inter-domain and T cell receptor-peptide-MHC (class I) association angles
Abstract
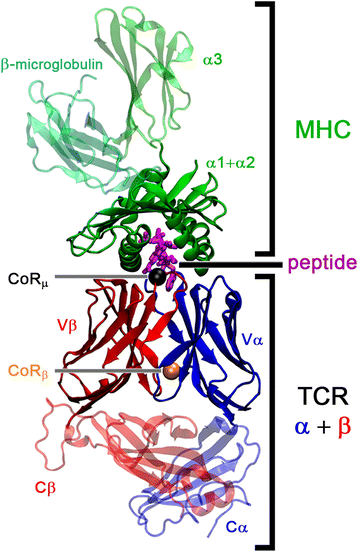
Background: T cell receptor (TCR) molecules are involved in the adaptive immune response as they distinguish between self- and foreign-peptides, presented in major histocompatibility complex molecules (pMHC). Former studies showed that the association angles of the TCR variable domains (Vα/Vβ) can differ significantly and change upon binding to the pMHC complex. These changes can be described as a rotation of the domains around a general Center of Rotation, characterized by the interaction of two highly conserved glutamine residues.
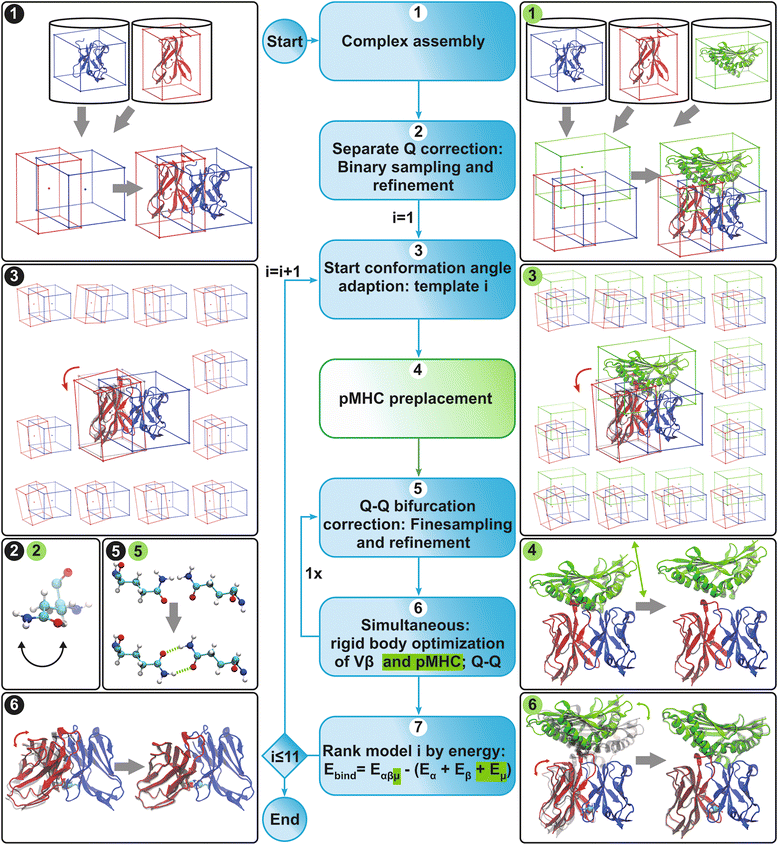
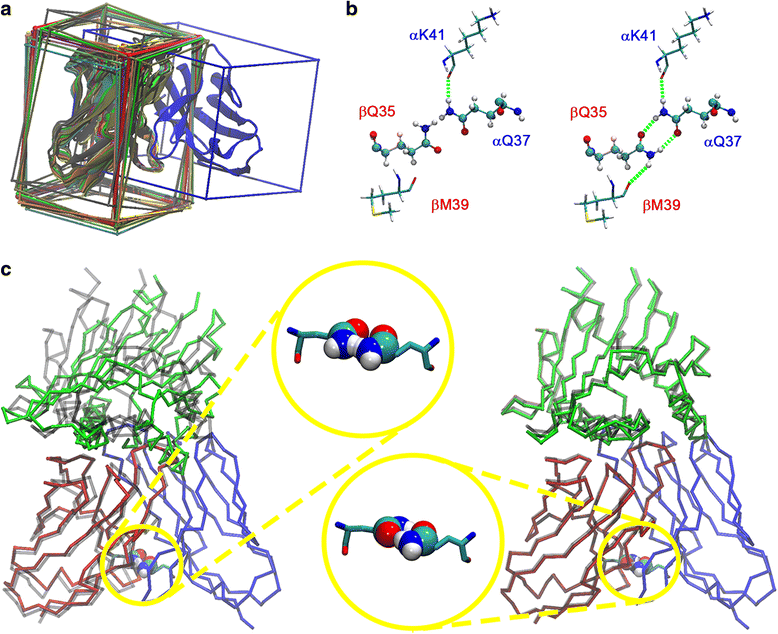
Methods: We developed a computational method, DynaDom, for the prediction of TCR Vα/Vβ inter-domain and TCR/pMHC orientations in TCRpMHC complexes, which allows predicting the orientation of multiple protein-domains. In addition, we implemented a new approach to predict the correct orientation of the carboxamide endgroups in glutamine and asparagine residues, which can also be used as an external, independent tool.
Results: The approach was evaluated for the remodeling of 75 and 53 experimental structures of TCR and TCRpMHC (class I) complexes, respectively. We show that the DynaDom method predicts the correct orientation of the TCR Vα/Vβ angles in 96 and 89% of the cases, for the poses with the best RMSD and best interaction energy, respectively. For the concurrent prediction of the TCR Vα/Vβ and pMHC orientations, the respective rates reached 74 and 72%. Through an exhaustive analysis, we could show that the pMHC placement can be further improved by a straightforward, yet very time intensive extension of the current approach.
Conclusions: The results obtained in the present remodeling study prove the suitability of our approach for interdomain-angle optimization. In addition, the high prediction rate obtained specifically for the energetically highest ranked poses further demonstrates that our method is a powerful candidate for blind prediction. Therefore it should be well suited as part of any accurate atomistic modeling pipeline for TCRpMHC complexes and potentially other large molecular assemblies.
Keywords: Adoptive T-cell therapy; Epitope prediction; Glutamine side chain prediction; Immunoinformatics; Protein domain association angles; T-cell recognition; TCR structural modeling; Vaccine design.
Figures


Similar articles
-
Quantitative Analysis of the Association Angle between T-cell Receptor Vα/Vβ Domains Reveals Important Features for Epitope Recognition.PLoS Comput Biol. 2015 Jul 17;11(7):e1004244. doi: 10.1371/journal.pcbi.1004244. eCollection 2015 Jul. PLoS Comput Biol. 2015. PMID: 26185983 Free PMC article.
-
Topology of T cell receptor-peptide/class I MHC interaction defined by charge reversal complementation and functional analysis.J Mol Biol. 1997 Aug 15;271(2):278-93. doi: 10.1006/jmbi.1997.1169. J Mol Biol. 1997. PMID: 9268659
-
An alphabeta T cell receptor structure at 2.5 A and its orientation in the TCR-MHC complex.Science. 1996 Oct 11;274(5285):209-19. doi: 10.1126/science.274.5285.209. Science. 1996. PMID: 8824178
-
A structural voyage toward an understanding of the MHC-I-restricted immune response: lessons learned and much to be learned.Immunol Rev. 2012 Nov;250(1):61-81. doi: 10.1111/j.1600-065X.2012.01159.x. Immunol Rev. 2012. PMID: 23046123 Review.
-
Specificity on a knife-edge: the alphabeta T cell receptor.Curr Opin Struct Biol. 2006 Dec;16(6):787-95. doi: 10.1016/j.sbi.2006.09.004. Epub 2006 Sep 29. Curr Opin Struct Biol. 2006. PMID: 17011774 Review.
Cited by
-
A Simplified Amino Acidic Alphabet to Unveil the T-Cells Receptors Antigens: A Computational Perspective.Front Chem. 2021 Feb 25;9:598802. doi: 10.3389/fchem.2021.598802. eCollection 2021. Front Chem. 2021. PMID: 33718327 Free PMC article.
-
TCRpMHCmodels: Structural modelling of TCR-pMHC class I complexes.Sci Rep. 2019 Oct 10;9(1):14530. doi: 10.1038/s41598-019-50932-4. Sci Rep. 2019. PMID: 31601838 Free PMC article.
-
T-Cell Receptor Cognate Target Prediction Based on Paired α and β Chain Sequence and Structural CDR Loop Similarities.Front Immunol. 2019 Aug 28;10:2080. doi: 10.3389/fimmu.2019.02080. eCollection 2019. Front Immunol. 2019. PMID: 31555288 Free PMC article.
-
Information-Driven Docking for TCR-pMHC Complex Prediction.Front Immunol. 2021 Jun 9;12:686127. doi: 10.3389/fimmu.2021.686127. eCollection 2021. Front Immunol. 2021. PMID: 34177934 Free PMC article.
-
Interpreting T-Cell Cross-reactivity through Structure: Implications for TCR-Based Cancer Immunotherapy.Front Immunol. 2017 Oct 4;8:1210. doi: 10.3389/fimmu.2017.01210. eCollection 2017. Front Immunol. 2017. PMID: 29046675 Free PMC article.
References
-
- Warren RL, Freeman JD, Zeng T, Choe G, Munro S, Moore R, Webb JR, Holt RA. Exhaustive T-cell repertoire sequencing of human peripheral blood samples reveals signatures of antigen selection and a directly measured repertoire size of at least 1 million clonotypes. Genome Res. 2011;21(5):790–797. doi: 10.1101/gr.115428.110. - DOI - PMC - PubMed
Publication types
MeSH terms
Substances
LinkOut - more resources
Full Text Sources
Other Literature Sources
Research Materials

