. 2017 Feb 2;18(1):12.
doi: 10.1186/s12860-017-0128-x.

Variation in human dental pulp stem cell ageing profiles reflect contrasting proliferative and regenerative capabilities

Affiliations

Variation in human dental pulp stem cell ageing profiles reflect contrasting proliferative and regenerative capabilities

Amr Alraies et al. BMC Cell Biol. .

Abstract

Background: Dental pulp stem cells (DPSCs) are increasingly being recognized as a viable cell source for regenerative medicine. Although significant variations in their ex vivo expansion are well-established, DPSC proliferative heterogeneity remains poorly understood, despite such characteristics influencing their regenerative and therapeutic potential. This study assessed clonal human DPSC regenerative potential and the impact of cellular senescence on these responses, to better understand DPSC functional behaviour.

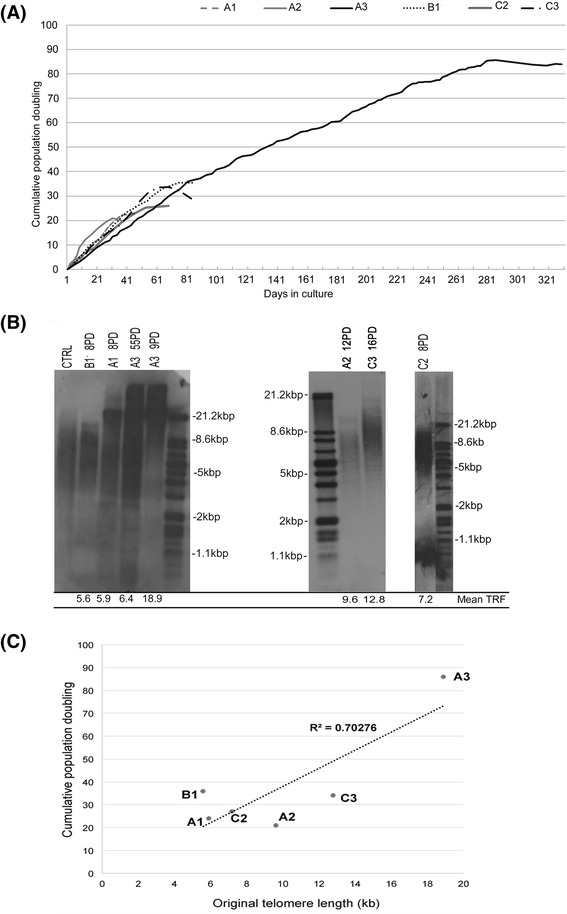
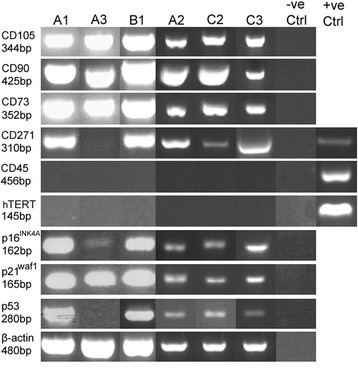
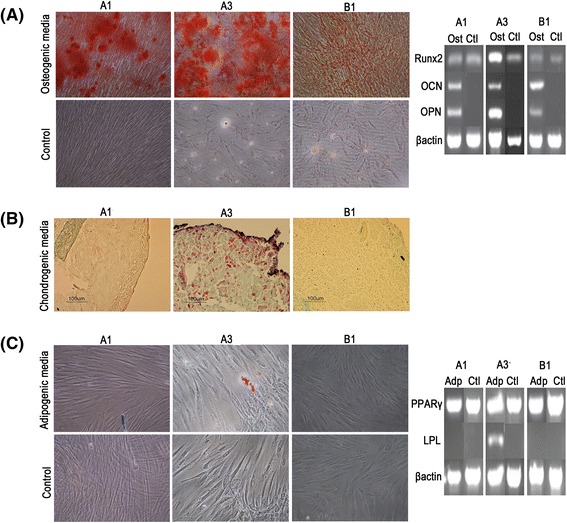
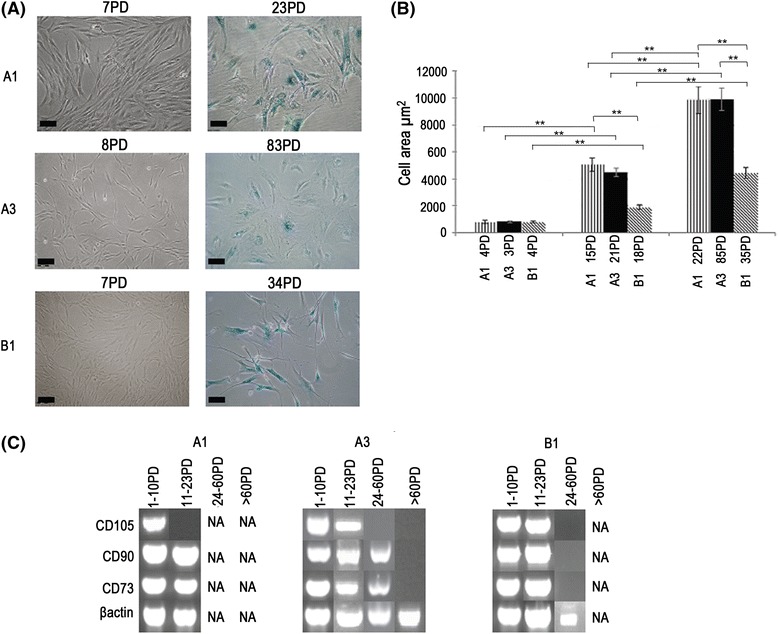
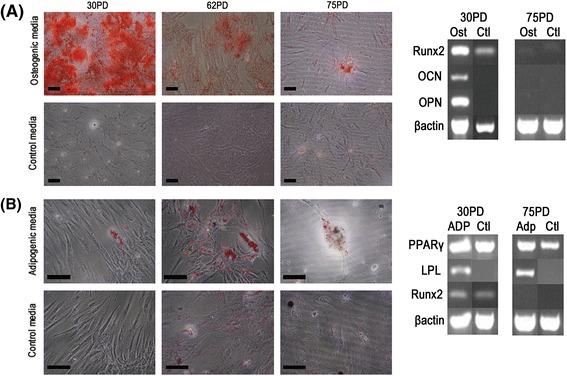
Results: All DPSCs were negative for hTERT. Whilst one DPSC population reached >80 PDs before senescence, other populations only achieved <40 PDs, correlating with DPSCs with high proliferative capacities possessing longer telomeres (18.9 kb) than less proliferative populations (5-13 kb). High proliferative capacity DPSCs exhibited prolonged stem cell marker expression, but lacked CD271. Early-onset senescence, stem cell marker loss and positive CD271 expression in DPSCs with low proliferative capacities were associated with impaired osteogenic and chondrogenic differentiation, favouring adipogenesis. DPSCs with high proliferative capacities only demonstrated impaired differentiation following prolonged expansion (>60 PDs).

Conclusions: This study has identified that proliferative and regenerative heterogeneity is related to contrasting telomere lengths and CD271 expression between DPSC populations. These characteristics may ultimately be used to selectively screen and isolate high proliferative capacity/multi-potent DPSCs for regenerative medicine exploitation.

Keywords: CD271; Cellular senescence; Cumulative population doublings; Dental pulp; Differentiation; Multi-potency; Stem cells; Telomeres.


Figures

Fig. 1
Fig. 1
Characterisation of DPSC populations derived from human dental pulp tissues. a Cumulative population doublings (PDs) were recorded for six DPSC populations during extended culture until senescence was reached, when PDs reached <0.5 PDs / week. DPSCs A1, A2 and A3 were derived from patient A, while B1, C2 and C3 were derived from patients B and C, respectively. Population A3 demonstrated high proliferative capacity, achieving >80 PDs over 280 days in culture, whilst the other DPSC populations only achieved 20–35 PDs over 35–85 days in culture. b Telomere length analysis for the six DPSC populations at cited PDs, by Southern blotting. Average telomere lengths were calculated using ImageJ® Software. Much longer telomeres were identified with high proliferative capacity, A3 (18.9 kb), compared with low proliferative capacity populations, A1 (5.9 kb), A2 (9.6 kb), B1 (5.6 kb), C2 (7.2 kb) and C3 (12.8 kb). A3 (18.9 kb, 9 PDs) only exhibited equivalent telomere lengths to low proliferative capacity DPSCs, at much later PDs towards the end of its proliferative lifespan (6.4 kb, 55 PDs). CTRL lanes represent the separate DIG-labelled, Control DNA sample. Average telomere lengths values obtained for each CTRL lane from left-right, were 10.6 ± 0.73 kb, 11.4 ± 0.71 kb and 11.1 ± 0.60 kb, respectively. Separated DIG-labelled telomere length standards are also included. c Correlation between cumulative PDs versus original telomere lengths for all DPSCs analysed
Fig. 2
Fig. 2
Gene expression analysis of DPSC populations by RT-PCR, at early PDs. All DPSCs showed positive expression for the MSC markers, CD73, CD90 and CD105; and the absence of the hematopoietic marker, CD45. All DPSCs analysed were also negative for hTERT. Only low proliferative capacity DPSCs (A1, A2, B1, C2 and C3) were positive for the expression of CD271 (nerve growth factor receptor p75, LNGFR) and for all 3 senescence-associated marker genes analysed, p53, p21waf1 and p16INK4a. Replacement of cDNA with H2O served as negative controls, with β-actin serving as the reference housekeeping gene
Fig. 3
Fig. 3
Osteogenic, chondrogenic and adipogenic differentiation of DPSCs. Tri-lineage differentiation analysis was compared between high proliferative capacity, A3 (30 PDs) and low proliferative capacity DPSCs, A1 (11 PDs) and B1 (15 PDs). a Osteogenesis was confirmed for each DPSC population by the detection of alizarin red staining for mineralised calcium nodules. No staining was observed in control DPSC cultures in the absence of osteogenic medium. RT-PCR analysis of osteogenic markers (right panel) indicated increased osteocalcin (OCN) and osteopontin (OPN) expression for DPSCs cultured in osteogenic media. Cells maintained in both osteogenic and control media expressed Runx2. b Chondrogenesis was only particularly evident with high proliferative capacity, A3, which exhibited positive Safranin O staining for high proteoglycan content. No Safranin O staining was observed with the low proliferative capacity DPSCs, A1 and B1. c Adipogenesis was only particularly evident with high proliferative capacity, A3, which exhibited positive Oil Red O staining for intracellular lipid-rich vacuole accumulation. No Oil Red O staining was observed with the low proliferative capacity DPSCs, A1 and B1; or in control cultures in the absence of adipogenic medium. RT-PCR analysis of adipogenic markers (right panel) indicated increased expression of the early adipogenic marker, PPARγ, in all DPSCs maintained in both adipogenic and control cultures; whilst the late adipogenic marker, lipoprotein lipase (LPL), was only expressed in high proliferative capacity, A3, in adipogenic media. Scale bars = 100 μm. β-actin served as the reference housekeeping gene
Fig. 4
Fig. 4
Effects of prolonged in vitro culture expansion on DPSC ageing characteristics. a Digital images representing the extent of senescence-associated β-galactosidase staining by DPSCs at early PDs (7–8 PDs) and towards the end of their respective proliferative lifespans (A1 at 23 PDs, A3 at 83 PDs and B1 at 34 PDs). At 7–8 PDs, all DPSCs were morphologically similar, with the characteristic MSC morphology and were negative for β-galactosidase staining. At PDs towards the later stages of their respective proliferative lifespans, higher percentages of cells stained positive for β-galactosidase, which were larger, more stellate-like and with prominent stress fibres. Scale bars = 100 μm. b Analysis of cellular surface area throughout the proliferative lifespan of A1, A3 and B1, using ImageJ® Software (average ± SE, **p < 0.001). Significant increases in each DPSC population’s surface area were identified with proliferative lifespan. Only when high proliferative capacity, A3, reached senescence (85 PDs) were surface areas non-significantly different to senescent A1 populations at 22 PDs (p > 0.05). Senescent B1 surface areas at 35 PDs did not reach the cell area sizes of senescent A1 or A3 at 22 PDs and 85 PDs, respectively. c Gene expression of the MSC markers, CD73, CD90 and CD105, was gradually lost during in vitro expansion. CD105 was lost initially, based on expression levels in A1 (11 PDs) and A3 (24 PDs), whilst CD90 and CD73 expression was subsequently lost towards the end of each population’s respective proliferative lifespans. Whilst the premature loss of CD105 was not as apparent with B1, all three markers were lost towards the end of its proliferative lifespan (24 PDs). NA indicates that no cells were available for analysis at these PDs. β-actin served as the reference housekeeping gene
Fig. 5
Fig. 5
Effects of prolonged in vitro culture expansion on DPSC differentiation capabilities. a Osteogenic differentiation potential of high proliferative capacity, A3, was greatly reduced following culture expansion from 30 PDs, to 62 PDs and 75 PDs; apparent by a reduction in alizarin red staining and the loss of osteogenic marker Runx2, osteocalcin (OCN) and osteopontin (OPN) expression (right panel). b Loss of A3 osteogenic differentiation potential was concomitant with the increased presence of enlarged intracellular lipid vesicles (Oil Red O staining) and the increased expression of early and late adipogenic markers, PPARγ and lipoprotein lipase (LPL, right panel). No staining was observed in control cultures in the absence of osteogenic or adipogenic media. Scale bars = 100 μm

Similar articles

Cited by

References

    1. Huang GT, Gronthos S, Shi S. Mesenchymal stem cells derived from dental tissues vs. those from other sources: Their biology and role in regenerative medicine. J Dent Res. 2009;88(9):792–806. doi: 10.1177/0022034509340867. - DOI - PMC - PubMed
    1. Sloan AJ, Waddington RJ. Dental pulp stem cells: What, where, how? Int J Paediatr Dent. 2009;19(1):61–70. doi: 10.1111/j.1365-263X.2008.00964.x. - DOI - PubMed
    1. Kawashima N. Characterisation of dental pulp stem cells: A new horizon for tissue regeneration? Arch Oral Biol. 2012;57(11):1439–58. doi: 10.1016/j.archoralbio.2012.08.010. - DOI - PubMed
    1. Tatullo M, Marrelli M, Shakesheff KM, White LJ. Dental pulp stem cells: function, isolation and applications in regenerative medicine. J Tissue Eng Regen Med. 2015;9(11):1205–16. doi: 10.1002/term.1899. - DOI - PubMed
    1. Gronthos S, Brahim J, Li W, Fisher LW, Cherman N, Boyde A, et al. Stem cell properties of human dental pulp stem cells. J Dent Res. 2002;81(8):531–5. doi: 10.1177/154405910208100806. - DOI - PubMed

Publication types