. 2017 Apr 1;28(7):875-882.
doi: 10.1091/mbc.E16-08-0561. Epub 2017 Feb 1.

Calcium signals drive cell shape changes during zebrafish midbrain-hindbrain boundary formation

Affiliations

Calcium signals drive cell shape changes during zebrafish midbrain-hindbrain boundary formation

Srishti U Sahu et al. Mol Biol Cell. .

Abstract

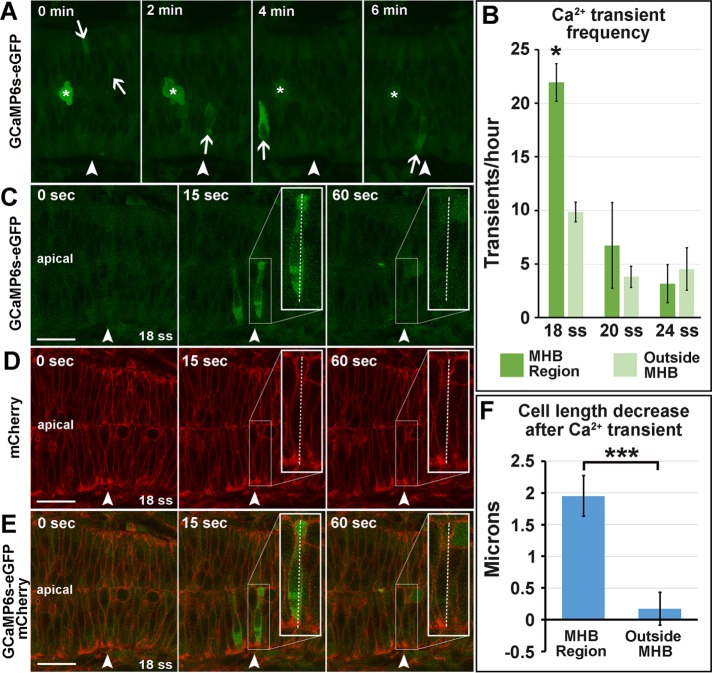
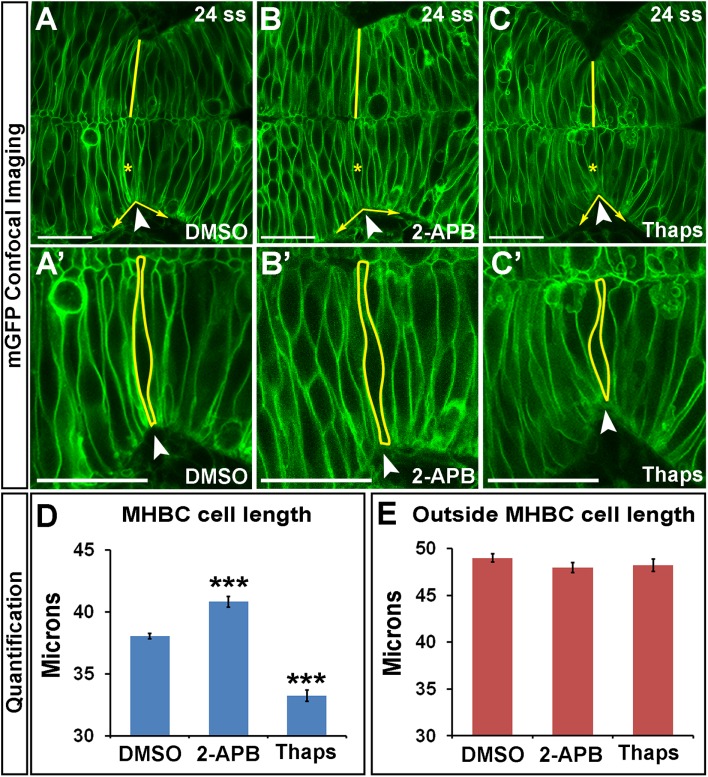
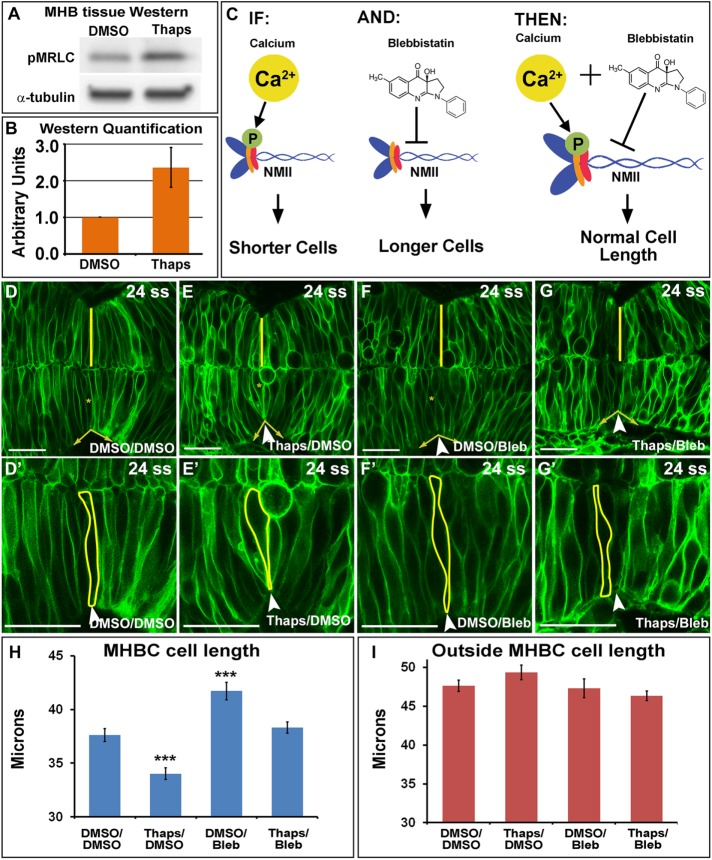
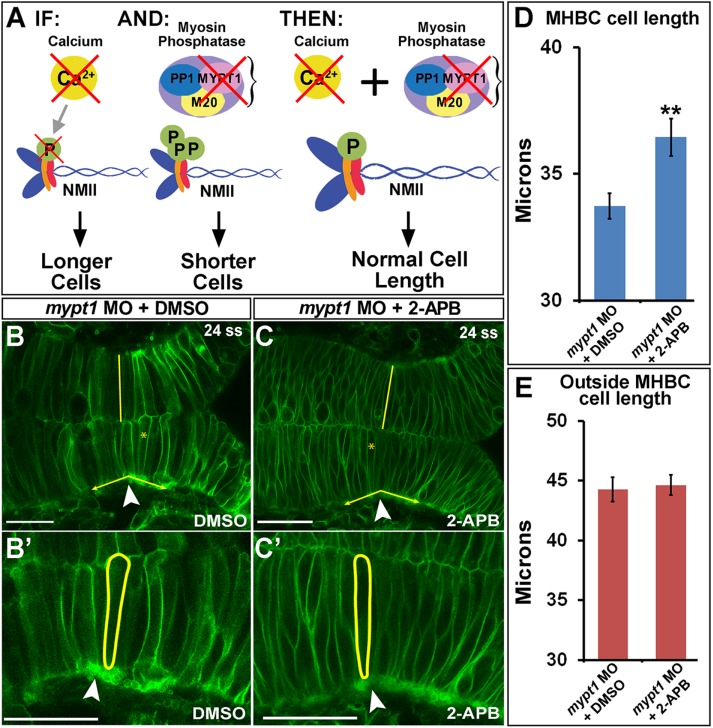
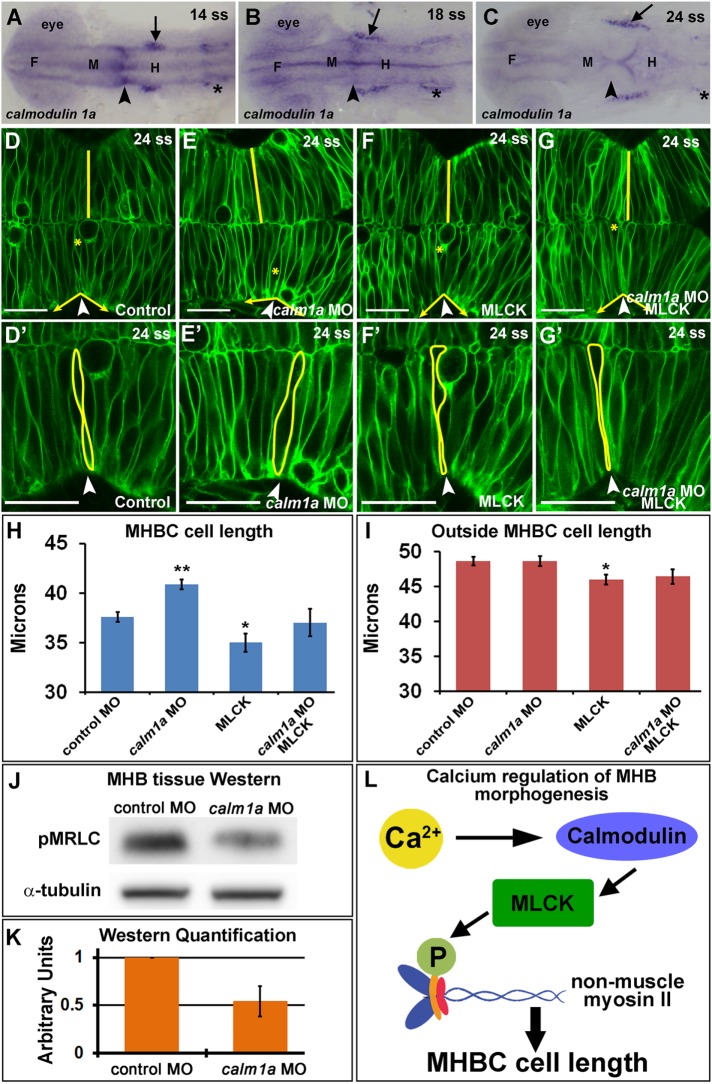
One of the first morphogenetic events in the vertebrate brain is the formation of the highly conserved midbrain-hindbrain boundary (MHB). Specific cell shape changes occur at the point of deepest constriction of the MHB, the midbrain-hindbrain boundary constriction (MHBC), and are critical for proper MHB formation. These cell shape changes are controlled by nonmuscle myosin II (NMII) motor proteins, which are tightly regulated via the phosphorylation of their associated myosin regulatory light chains (MRLCs). However, the upstream signaling pathways that initiate the regulation of NMII to mediate cell shape changes during MHB morphogenesis are not known. We show that intracellular calcium signals are critical for the regulation of cell shortening during initial MHB formation. We demonstrate that the MHB region is poised to respond to calcium transients that occur in the MHB at the onset of MHB morphogenesis and that calcium mediates phosphorylation of MRLC specifically in MHB tissue. Our results indicate that calmodulin 1a (calm1a), expressed specifically in the MHB, and myosin light chain kinase together mediate MHBC cell length. Our data suggest that modulation of NMII activity by calcium is critical for proper regulation of cell length to determine embryonic brain shape during development.


Figures

FIGURE 1:
FIGURE 1:
Calcium transients are enriched in the MHB at 18 ss and precede decreases in cell length. (A) Representative wild-type 18 ss time-lapse images of intracellular Ca2+ transients (panels from Supplemental Movie S1). Asterisks indicate mitotic cells, and arrows indicate Ca2+ transients analyzed. (B) Quantification of Ca2+ transients at 18, 20, and 24 ss. (C–E) Representative wild-type images at 18 ss analyzed for cell length changes after Ca2+ transients. (F) Quantification indicating the amount of decrease in cell length immediately after Ca2+ transients. For statistical analysis, one-way ANOVA with Tukey’s HSD post hoc test was conducted for Ca2+ transient frequency. *p < 0.05, mean ± SEM. Embryos analyzed: 18 ss, n = 11; 20 ss, n = 10; 24 ss, n = 8. Mann–Whitney U test was performed for analysis of cell length decrease after Ca2+ transients. ***p < 0.001, mean ± SEM. Embryos analyzed, n = 10; MHB region cells, 17; outside MHB cells, 6. Arrowheads indicate the MHBC. Scale bars, 25 μm.
FIGURE 2:
FIGURE 2:
Calcium regulates cell length at the MHBC. (A–C′) Confocal images of embryos injected with mGFP and treated at 18 ss with (A, A′) DMSO, (B, B′) 100 μM 2-APB, or (C, C′) 2 μM Thaps. Embryos were washed, incubated, and live imaged at 24 ss. (A′–C′) Magnifications of A–C. Arrowheads indicate the MHBC. Asterisks in A–C indicate cell outlined in A′–C′. (D, E) Cell length quantification at the MHBC and 40 μm outside the MHBC. For statistical analysis, one-way ANOVA with Tukey’s HSD post hoc test was done. ***p < 0.001 compared with DMSO, mean ± SEM. For each measurement, DMSO (n = 29; 58 cells), 2-APB (n = 16; 32 cells), and Thaps (n = 14; 28 cells). Scale bars, 25 μm.
FIGURE 3:
FIGURE 3:
Calcium signals to NMII at the MHB to modulate MHBC cell length. (A) Representa­tive Western blot for pMRLC in MHB-specific tissue dissected after DMSO or 2 μM Thaps treatment. (B) pMRLC Western quantification using α-tubulin as a control (n = 4). (C) Hypothesized role of Ca2+ and NMII interactions. IF, increase in Ca2+ leads to increased pMRLC to activate NMII and causes shorter cells at the MHBC; AND, Bleb inhibits NMII function; THEN, Thaps treatment to increase Ca2+ leading to shorter cells can be rescued with NMII inhibition by Bleb. (D–G′) Confocal images of mGFP-injected embryos treated with (D, D′) DMSO/DMSO, (E, E′) Thaps/DMSO, (F, F′) DMSO/Bleb, or (G, G′) Thaps/Bleb. (D′–G′) Magnifications of D–G. Arrowheads indicate the MHBC. Asterisks in D–G indicate cell outlined in D′–G′. (H, I) Cell length quantification at the MHBC and 40 μm outside the MHBC. For statistical analysis, one-way ANOVA with Tukey’s HSD post hoc test was done. ***p < 0.001 compared with DMSO/DMSO; mean ± SEM. For each measurement, DMSO/DMSO (n = 9; 18 cells), Thaps/DMSO (n = 9; 18 cells), DMSO/Bleb (n = 7; 14 cells), and Thaps/Bleb (n = 8; 16 cells). Scale bars, 25 μm.
FIGURE 4:
FIGURE 4:
Calcium inhibition rescues NMII overactivation at the MHBC. (A) Hypothesized role of Ca2+ and NMII interactions. IF, inhibition of Ca2+ by 2-APB results in longer MHBC cells; AND, mypt1 knockdown results in overactivation of MRLC, causing shorter and wider MHB cells; THEN, inhibition of Ca2+ in mypt1-knockdown embryos would rescue MHBC cell length. (B, C) Confocal images of 24-ss embryos coinjected with mGFP and mypt1 MO and treated with (B) DMSO or (C) 2-APB. (B′, C′) Magnified images from B and C. Arrowheads indicate MHBC. (D, E) Cell length quantification at the MHBC and 40 μm outside the MHBC. For statistical analysis, the Mann–Whitney U test was done. **p < 0.01, mean ± SEM. For each measurement, mypt1 MO plus DMSO (n = 11; 22 cells) and mypt1 MO plus 2-APB (n = 13; 26 cells). Scale bars, 25 μm.
FIGURE 5:
FIGURE 5:
Calmodulin 1a and MLCK mediate cell length at the MHBC. (A–C) calm1a gene expression by in situ hybridization. Arrowheads indicate MHBC, and arrows indicate trigeminal ganglia; asterisks indicate otic vesicle. F, forebrain; M, midbrain; H, hindbrain. (D–G′) Confocal images of embryos injected with mGFP and (D, D′) control MO, (E, E′) calm1a MO, (F, F′) MLCK mRNA, or (G, G′) calm1a MO and MLCK mRNA. (D′–G′) Magnification of D–G. Arrowheads indicate the MHBC. Asterisks in D–G indicate cell outlined in D′–G′. (H, I) Cell length quantification at the MHBC and 40 μm outside the MHBC. (J) Representative Western blots for pMRLC in MHB-specific tissue dissected after control MO or calm1a MO injection. (K) pMRLC Western quantification using α-tubulin as a control (n = 5). (L) Proposed signaling pathway for Ca2+ regulation of cell length at the MHBC. For statistical analysis, one-way ANOVA with Tukey’s HSD post hoc test was done. **p < 0.01 and *p < 0.05 compared with control, mean ± SEM. Control MO (n = 17; 34 cells), calm1a MO (n = 19; 38 cells), MLCK mRNA (n = 13; 26 cells), and calm1a MO plus MLCK (n = 9; 18 cells). Scale bars, 25 μm.

Similar articles

Cited by

References

    1. Ashworth R, Devogelaere B, Fabes J, Tunwell RE, Koh KR, De Smedt H, Patel S. Molecular and functional characterization of inositol trisphosphate receptors during early zebrafish development. J Biol Chem. 2007;282:13984–13993. - PubMed
    1. Barreda EG, Avila J. Tau regulates the subcellular localization of calmodulin. Biochem Biophys Res Commun. 2011;408:500–504. - PubMed
    1. Berridge MJ, Lipp P, Bootman MD. The versatility and universality of calcium signalling. Nat Rev. 2000;1:11–21. - PubMed
    1. Bootman MD, Collins TJ, Mackenzie L, Roderick HL, Berridge MJ, Peppiatt CM. 2-aminoethoxydiphenyl borate (2-APB) is a reliable blocker of store-operated Ca2+ entry but an inconsistent inhibitor of InsP3-induced Ca2+ release. FASEB J. 2002;16:1145–1150. - PubMed
    1. Bramlage P, Joss G, Staudt A, Jarrin A, Podlowski S, Baumann G, Stangl K, Felix SB, Stangl V. Computer-aided measurement of cell shortening and calcium transients in adult cardiac myocytes. Biotechnol Prog. 2001;17:929–934. - PubMed

MeSH terms

LinkOut - more resources