Oscillatory wall shear stress is a dominant flow characteristic affecting lesion progression patterns and plaque vulnerability in patients with coronary artery disease
- PMID: 28148771
- PMCID: PMC5332583
- DOI: 10.1098/rsif.2016.0972
Oscillatory wall shear stress is a dominant flow characteristic affecting lesion progression patterns and plaque vulnerability in patients with coronary artery disease
Abstract
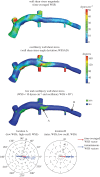
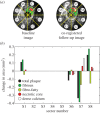
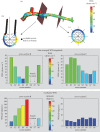
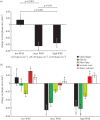
Although experimental studies suggest that low and oscillatory wall shear stress (WSS) promotes plaque transformation to a more vulnerable phenotype, this relationship has not been examined in human atherosclerosis progression. Thus, the aim of this investigation was to examine the association between oscillatory WSS, in combination with WSS magnitude, and coronary atherosclerosis progression. We hypothesized that regions of low and oscillatory WSS will demonstrate progression towards more vulnerable lesions, while regions exposed to low and non-oscillatory WSS will exhibit progression towards more stable lesions. Patients (n = 20) with non-flow-limiting coronary artery disease (CAD) underwent baseline and six-month follow-up angiography, Doppler velocity and radiofrequency intravascular ultrasound (VH-IVUS) acquisition. Computational fluid dynamics models were constructed to compute time-averaged WSS magnitude and oscillatory WSS. Changes in VH-IVUS-defined total plaque and constituent areas were quantified in focal regions (i.e. sectors; n = 14 235) and compared across haemodynamic categories. Compared with sectors exposed to low WSS magnitude, high WSS sectors demonstrated regression of total plaque area (p < 0.001) and fibrous tissue (p < 0.001), and similar progression of necrotic core. Sectors subjected to low and oscillatory WSS exhibited total plaque area regression, while low and non-oscillatory WSS sectors demonstrated total plaque progression (p < 0.001). Furthermore, compared with low and non-oscillatory WSS areas, sectors exposed to low and oscillatory WSS demonstrated regression of fibrous (p < 0.001) and fibrofatty (p < 0.001) tissue and similar progression of necrotic core (p = 0.82) and dense calcium (p = 0.40). Herein, we demonstrate that, in patients with non-obstructive CAD, sectors subjected to low and oscillatory WSS demonstrated regression of total plaque, fibrous and fibrofatty tissue, and progression of necrotic core and dense calcium, which suggest a transformation to a more vulnerable phenotype.
Keywords: atherosclerosis; computational fluid dynamics; coronary artery disease; haemodynamics; intravascular ultrasound; wall shear stress.
© 2017 The Author(s).
Figures



Similar articles
-
Coronary artery wall shear stress is associated with progression and transformation of atherosclerotic plaque and arterial remodeling in patients with coronary artery disease.Circulation. 2011 Aug 16;124(7):779-88. doi: 10.1161/CIRCULATIONAHA.111.021824. Epub 2011 Jul 25. Circulation. 2011. PMID: 21788584 Clinical Trial.
-
Combination of plaque burden, wall shear stress, and plaque phenotype has incremental value for prediction of coronary atherosclerotic plaque progression and vulnerability.Atherosclerosis. 2014 Feb;232(2):271-6. doi: 10.1016/j.atherosclerosis.2013.11.049. Epub 2013 Dec 1. Atherosclerosis. 2014. PMID: 24468138
-
Comparison of angiographic and IVUS derived coronary geometric reconstructions for evaluation of the association of hemodynamics with coronary artery disease progression.Int J Cardiovasc Imaging. 2016 Sep;32(9):1327-1336. doi: 10.1007/s10554-016-0918-9. Epub 2016 May 26. Int J Cardiovasc Imaging. 2016. PMID: 27229349
-
High Coronary Wall Shear Stress Worsens Plaque Vulnerability: A Systematic Review and Meta-Analysis.Angiology. 2021 Sep;72(8):706-714. doi: 10.1177/0003319721991722. Epub 2021 Feb 4. Angiology. 2021. PMID: 33535802 Free PMC article.
-
Shear stress and advanced atherosclerosis in human coronary arteries.J Biomech. 2013 Jan 18;46(2):240-7. doi: 10.1016/j.jbiomech.2012.11.006. Epub 2012 Dec 20. J Biomech. 2013. PMID: 23261245 Review.
Cited by
-
Evaluation of Plaque Characteristics and Inflammation Using Magnetic Resonance Imaging.Biomedicines. 2021 Feb 12;9(2):185. doi: 10.3390/biomedicines9020185. Biomedicines. 2021. PMID: 33673124 Free PMC article. Review.
-
Prediction of Long Term Restenosis Risk After Surgery in the Carotid Bifurcation by Hemodynamic and Geometric Analysis.Ann Biomed Eng. 2019 Apr;47(4):1129-1140. doi: 10.1007/s10439-019-02201-8. Epub 2019 Jan 18. Ann Biomed Eng. 2019. PMID: 30659434 Clinical Trial.
-
Inflammatory Cytokines and Atherosclerotic Plaque Progression. Therapeutic Implications.Curr Atheroscler Rep. 2020 Oct 6;22(12):75. doi: 10.1007/s11883-020-00891-3. Curr Atheroscler Rep. 2020. PMID: 33025148 Free PMC article. Review.
-
Uncovering emergent phenotypes in endothelial cells by clustering of surrogates of cardiovascular risk factors.Sci Rep. 2022 Jan 25;12(1):1372. doi: 10.1038/s41598-022-05404-7. Sci Rep. 2022. PMID: 35079076 Free PMC article.
-
The Relationship between Coronary Artery Wall Shear Strain and Plaque Morphology: A Systematic Review and Meta-Analysis.Diagnostics (Basel). 2020 Feb 8;10(2):91. doi: 10.3390/diagnostics10020091. Diagnostics (Basel). 2020. PMID: 32046306 Free PMC article.
References
Publication types
MeSH terms
LinkOut - more resources
Full Text Sources
Other Literature Sources
Medical
Research Materials
Miscellaneous

