. 2017 Feb 2:7:41506.
doi: 10.1038/srep41506.

Photodynamic therapy monitoring with optical coherence angiography

Affiliations

Photodynamic therapy monitoring with optical coherence angiography

M A Sirotkina et al. Sci Rep. .

Abstract

Photodynamic therapy (PDT) is a promising modern approach for cancer therapy with low normal tissue toxicity. This study was focused on a vascular-targeting Chlorine E6 mediated PDT. A new angiographic imaging approach known as M-mode-like optical coherence angiography (MML-OCA) was able to sensitively detect PDT-induced microvascular alterations in the mouse ear tumour model CT26. Histological analysis showed that the main mechanisms of vascular PDT was thrombosis of blood vessels and hemorrhage, which agrees with angiographic imaging by MML-OCA. Relationship between MML-OCA-detected early microvascular damage post PDT (within 24 hours) and tumour regression/regrowth was confirmed by histology. The advantages of MML-OCA such as direct image acquisition, fast processing, robust and affordable system opto-electronics, and label-free high contrast 3D visualization of the microvasculature suggest attractive possibilities of this method in practical clinical monitoring of cancer therapies with microvascular involvement.


Conflict of interest statement

The authors declare no competing financial interests.

Figures

Figure 1
Figure 1. Effect of PDT on CT26 tumour growth.
(a) Individual tumour volumes in the PDT group. Seven of eleven tumours regressed after PDT; in two animals (#8, 9, there was tumour growth arrest but no volume decrease, and in two other cases (#10, 11) tumour growth continued despite PDT (b) Monitoring of relative tumour volume changes for treated (n = 11), light only (n = 5) and untreated (n = 5) control groups. Data are shown as mean ± SD. Tumour growth was overall inhibited by PDT in the treatment group, showing pronounced volume decrease. *Statistically significant difference from light-only and untreated groups, p ≤ 0.05. Inset demonstrates distribution of eleven tumour volumes at 7 days post PDT. Despite strong (and statistically significant) overall decrease in tumour volumes in the PDT group, the distribution of individual tumour volumes revealed the presence of two moderate responders and two non-responders in this cohort; see text for a discussion on this finding.
Figure 2
Figure 2. H&E histology of CT26 tumours 7 days after PDT.
(a) Untreated tumour; (b) light only group; (c) tumour after PDT with severe microvascular damages; (d) tumour after PDT with weak microvascular damages; (e) tumours after PDT with severe microvascular damages in the tumour and weak microvascular damages on the border with normal tissue. Yellow arrows indicate undamaged vessels; green arrows - hyperemia; blue arrows – thrombosis; white arrows - hemorrhage. (f) Schematic of the orientation of the histological sections. Trends of observed tissue changes were consistent throughout the tumour extent (i.e., similar in its central parts and at margins).
Figure 3
Figure 3
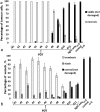
Quantitative assessment of morphological changes of tumour CT-26 at 7 days post PDT: (a) percentage of viable and necrotic cells in the tumour; (b) percentage of microvascular damages in the tumour. The result are shown as mean ± SD. Notice that in case of complete (necrotic) cell death, thrombosis dominated over the other types of microvascular damages.
Figure 4
Figure 4. Fluorescence images of ear tumour model CT26.
(a) White-light photograph of mouse; (b) flourescene intensity 1 hour after PS injection (before PDT); (c) immediately after PDT (the treatment laser spot size was 5 mm). The tumour is marked by arrow; irradiation field is marked by the white dotted circle. Immediately after PDT, the fluorescence signal in the exposed area declined because of PS photobleaching.
Figure 5
Figure 5
(a) Relationship between photosensitizer photobleaching (Equation (1)) and tumour volume quantified by TGI (Equation (2)). A weak correlation is seen (Pearson’s correlation coefficient r = 0.386, p = 0.241). (b) Fluorescence intensity versus TGI. An even weaker correlation noted (r = 0.052, p = 0.879).
Figure 6
Figure 6. MML-OCA images of microvascular alteration dynamics prior to, immediately following, 6-hrs post, and a day after PDT (100 J/cm2, 100 mW/cm2).
A maximum intensity projection 2D display is shown for ease of comparison, representing a 3D data to a depth of ~1.3 mm. (ac) – three separate examples of responding tumours, showing significant microvascular alterations within a day of treatment (or less); (d) example of a mildly responding tumour; (e) no microvascular changes were noted in the control animal; (f) schematic of MML-OCA scanning zone on the tumour (represented in 2D by the flesh-coloured irrelagular contour). Responding tumours’ microvascular inhibition as detected by MML-OCT at t < 24 hrs [(ac)] was seen by histology (at t = 7 days) to result from blood vessels thrombosis and hemorrhage (Fig. 2). Scale bar = 500 μm on all images.

Similar articles

Cited by

References

    1. Allison R. R. & Moghissi K. Photodynamic Therapy (PDT): PDT Mechanisms. Clin Endosc 46, 24–29 (2013). - PMC - PubMed
    1. Wilson B. C. & Patterson M. S. The physics, biophysics and technology of photodynamic therapy. Phys Med Biol 53, R61–R109 (2008). - PubMed
    1. Henderson B. W. & Dougherty T. J. How does photodynamic therapy work? Photochemistry and Photobiology 55(1), 145–157 (1992). - PubMed
    1. Dougherty T. J. et al.. Photodynamic Therapy. Journal of the National Cancer Institute 90(12), 889–905 (1998). - PMC - PubMed
    1. Fisher A. M., Murphree A. L. & Gomer C. J. Clinical and preclinical photodynamic therapy. Lasers Surg Med 17(1), 2–31 (1995). - PubMed

Publication types

Substances