. 2017 Feb 2:7:41572.
doi: 10.1038/srep41572.

Endoplasmic reticulum stress inhibition attenuates hypertensive chronic kidney disease through reduction in proteinuria

Affiliations

Endoplasmic reticulum stress inhibition attenuates hypertensive chronic kidney disease through reduction in proteinuria

Zahraa Mohammed-Ali et al. Sci Rep. .

Abstract

Endoplasmic reticulum (ER) stress is implicated in chronic kidney disease (CKD) development in patients and in animal models. Here we show that ER stress inhibition through 4-phenylbutyric acid (4-PBA) administration decreases blood pressure, albuminuria, and tubular casts in an angiotensin II/deoxycorticosterone acetate/salt murine model of CKD. Lower albuminuria in 4-PBA-treated mice was associated with higher levels of cubilin protein in renal tissue membrane fractions. 4-PBA decreased renal interstitial fibrosis, renal CD3+ T-cell and macrophage infiltration, mRNA expression of TGFβ1, Wnt signaling molecules, and ER stress-induced pro-inflammatory genes. CHOP deficient mice that underwent this model of CKD developed hypertension comparable to wild type mice, but had less albuminuria and tubular casts. CHOP deficiency resulted in higher nephrin levels and decreased glomerulosclerosis compared to wild type mice; this effect was accompanied by lower macrophage infiltration and fibrosis. Our findings portray ER stress inhibition as a means to alleviate hypertensive CKD by preserving glomerular barrier integrity and tubular function. These results demonstrate ER stress modulation as a novel target for preserving renal function in hypertensive CKD.


Conflict of interest statement

The authors declare no competing financial interests.

Figures
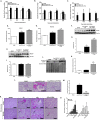
Figure 1
Figure 1. Effect of 4-PBA treatment on the development of hypertensive proteinuria.
Mice treated with Ang II/DOCA salt showed a significant increase in (A) systolic and (B) diastolic blood pressures at the day 7 (7D), 14 (14D), 18 (18D) and 21 (21D) time points (n = 5 per group) compared to their corresponding SHAM controls (n = 3–5 per group). Ang II/DOCA salt animals treated with 4-PBA (n = 5) did not show any change in (A) systolic and (B) diastolic blood pressure. (C) Total 24 h urinary albumin excretion was significantly increased by Ang II/DOCA salt at all time points, 7D (n = 5), 14D (n = 5), 18D (n = 4) and 21D (n = 6) compared to SHAM controls (n = 5–6), and was significantly reduced by 4-PBA treatment (n = 6). Normalized total counts for endocytic receptor mRNA (D) cubilin and (E) megalin show a significant increase with Ang II/DOCA salt (n = 3) treatment, and a further significant increase with 4-PBA treatment (n = 4) compared to SHAM controls (n = 3). (F,G) Protein levels of cubilin in whole kidney tissue lysates were significantly increased with Ang II/DOCA salt treatment (n = 3) and showed significantly higher levels with 4-PBA treatment (n = 3). (H,l) There was no change in kidney megalin protein levels with Ang II/DOCA salt treatment or 4-PBA treatment (n = 3 per group). (J,K) Membrane extracts from kidney tissue lysates showed significantly increased levels of membrane-embedded cubilin in the Ang II/DOCA salt group treated with 4-PBA (n = 3 per group). (L,M) 4-PBA significantly decreased glomerulosclerosis in Ang II/DOCA salt mice (n = 3 per group). (N,O) An increase in protein cast formation (arrows) was observed in Ang II/DOCA salt mice at all time points (n = 4–5 per group) compared to their respective SHAMs (n = 5–6), and is decreased with 4-PBA treatment (n = 6). 21D SHAM (n = 5) is used as a representative image for all shams. *Denotes significantly different than the corresponding SHAM; #indicates significantly different in the D21 Ang II/DOCA salt + 4-PBA compared to day 21 Ang II/DOCA salt. Scale bars = 100 μm in (L) and 200 μm in (N).
Figure 2
Figure 2. Effect of 4-PBA treatment on the UPR activation.
(A) Hierarchical clustering of ER stress and apoptotic genes is demonstrated using a heat map. Fold changes represent the changes in gene expression with Ang II/DOCA salt treatment at days 7 (7D; n = 4), 14 (14D; n = 5), 18 (18D; n = 3), 21 (21D; n = 5) and 21D + 4-PBA (n = 5) compared to their respective sham-operated controls. (B,D) CHOP and (C,E) phosphorylated IRE1α staining (60X) in the kidney was increased by Ang II/DOCA salt (n = 5 for 7D, 14D and 21D, n = 4 for 18D), as indicated by arrows, and inhibited by 4-PBA treatment (n = 5). The 21D SHAM group (n = 5 for cortex, n = 3 for medulla) is representative of all shams. *indicates that the Ang II/DOCA salt group is significantly different than corresponding SHAM at that time point; #indicates that the 21D + 4-PBA is significantly different than the 21D Ang II/DOCA salt group. Scale bars = 100 μm in (B) and (C).
Figure 3
Figure 3. Effect of 4-PBA treatment on renal fibrosis.
(A) Hierarchical clustering of fibrotic genes is demonstrated in a heat map. Fold changes represent the changes in gene expression with Ang II/DOCA salt treatment at days 7 (7D; n = 4), 14 (14D; n = 5), 18 (18D; n = 3), 21 (21D; n = 5) and 21D + 4-PBA (n = 5) compared to their respective sham-operated controls. (B,D) α-smooth muscle actin staining (arrows) (20X) is increased at all timepoints (n = 4 per group). (C,E) Collagen deposition (arrows), demonstrated using picrosirius red staining (20X), was significantly elevated at all timepoints (n = 5 for 7D, 14D and 18D and n = 4 for 21D). 4-PBA treatment (n = 3) significantly decreased both collagen and α-smooth muscle actin deposition in response to Ang II/DOCA salt. Only the representative sham, 21D SHAM group (n = 4 for cortex, n = 3 for medulla), is shown. *indicates that the Ang II/DOCA salt treatment is significantly different than corresponding sham at that time point; #indicates that the 21D + 4-PBA group is significantly different than the 21D Ang II/DOCA salt group. Scale bars = 200 μm in (B) and (C).
Figure 4
Figure 4. Effect of 4-PBA treatment on renal inflammation.
(A) A heat map demonstrates hierarchical clustering of inflammatory genes. Fold changes represent the changes in gene expression with Ang II/DOCA salt treatment at days 7 (7D; n = 4), 14 (14D; n = 5), 18 (18D; n = 3), 21 (21D; n = 5) and 21D + 4-PBA (n = 5), compared to their respective sham-operated controls. (B,D) F4/80 staining (40X; arrows) shows an increase in F4/80+ macrophage infiltration at 14D (n = 4), 18D (n = 5) and 21D (n = 5), but not at 7D (n = 6). (C,E) CD3 staining (60X; arrows) demonstrates significant T-cell infiltration at all time points (n = 4 per group). 4-PBA treatment (n = 3) significantly decreased macrophage and T-cell infiltration in response to Ang II/DOCA salt. Only the representative 21D SHAM is included in the figure (n = 5 for F4/80 staining, n = 4 for CD3 staining). *indicates that the Ang II/DOCA salt is significantly different than corresponding sham at that time point (n = 4–5 per group); #indicates that the 21D + 4-PBA is significantly different than the 21D Ang II/DOCA salt group. Scale bars = 100 μm in (B) and (C).
Figure 5
Figure 5. Effect of CHOP knockout on the development of hypertensive proteinuria.
Both wild type (WT) (n = 6) and CHOP−/− (n = 5) mice treated with the CKD model experienced an increase in (A) systolic and (B) diastolic blood pressures, compared to their respective SHAM controls (n = 6 for WT SHAM and n = 5 for CHOP−/− SHAM). (C) Although CHOP−/− mice (n = 5) showed an increase in albuminuria with CKD development compared to CHOP−/− SHAM mice (n = 6), they had significantly lower albuminuria compared to WT mice (n = 7). (D) Nephrin mRNA levels increase with Ang II/DOCA salt treatment compared to sham controls (n = 3 per group) and are significantly higher in CHOP−/− animals treated with Ang II/DOCA salt (n = 5) compared to WT Ang II/DOCA salt animals (n = 5). (E,F) Protein levels of nephrin were significantly increased in whole kidney tissue lysates (n = 3 per group) in CHOP−/− mice. (G,H) Significantly lower levels of GADD34 were observed in CHOP−/− mice. (I,J) CHOP−/− mice (n = 5) showed significantly lower glomerular sclerosis (arrows) compared to WT mice (n = 5) in response to Ang II/DOCA salt. (K–M) Protein cast formation (arrows; 20X) demonstrates less damage in CHOP−/− mice (n = 5) in response to Ang II/DOCA salt compared to treated WT mice (n = 5). There was no difference in glomerular score or protein cast formation between CHOP−/− sham (n = 6) and WT sham (n = 6). *indicates significantly different than the respective sham-operated controls; #indicates significant difference between the CHOP−/− Ang II/DOCA salt mice compared to WT Ang II/DOCA salt mice. Scale bars = 50 μm in (I) and 200 μm (K).
Figure 6
Figure 6. Effect of CHOP deficiency on UPR, fibrosis, and inflammatory gene expression.
Heat maps demonstrate hierarchical clustering of (A) UPR, (B) fibrotic, and (C) inflammatory genes. “WT” column represents fold changes in gene expression with Ang II/DOCA salt treatment in wild type (WT; n = 6) compared to WT SHAM (n = 3). “CHOP−/−” column represents fold changes in treated CHOP−/− mice (n = 5) compared to CHOP−/− sham mice (n = 3). Genes included in these heat maps are those that were significantly regulated in WT Ang II/DOCA salt-treated mice compared to WT sham at day 21. CHOP deficiency attenuated the upregulation of important pathways underlying CKD. *indicates that Ang II/DOCA salt CHOP−/− is significantly different than corresponding sham in CHOP−/− mice; #indicates that the gene is regulated in the opposite direction in CHOP−/− Ang II/DOCA salt mice compared to WT Ang II/DOCA salt mice.
Figure 7
Figure 7. Effect of CHOP deficiency on the development of fibrosis.
(A–C) α-smooth muscle actin staining (arrows; 20X) is reduced with CHOP deficiency. Extracellular matrix deposition was significantly increased by Ang II/DOCA salt in wild type (WT) mice (n = 5), but not in CHOP−/− mice (n = 5). *indicates that the Ang II/DOCA salt is significantly different than corresponding sham; #indicates that the CHOP−/− mice are significantly different than WT mice. Scale bars = 200 μm in (A).
Figure 8
Figure 8. Effect of CHOP deficiency on the development of inflammation.
(A–C) F4/80 staining (arrows; 40X) demonstrates that macrophage infiltration was significantly increased by Ang II/DOCA salt in wild type (WT; n = 4) but not in CHOP−/− mice (n = 5), compared to their corresponding sham controls (n = 4). *indicates that the Ang II/DOCA salt mice are significantly different than corresponding sham; #indicates that the CHOP−/− mice are significantly different than WT mice. Scale bars = 100 μm in (A).
Figure 9
Figure 9. Similarities in pathology between human and murine chronic kidney disease.
This Ang II/DOCA salt mouse model of chronic kidney disease (CKD) produces (A) protein cast formation, demonstrated by periodic acid-Schiff staining, and (B) fibrosis, demonstrated by Masson’s trichrome staining, at a comparable level to the kidney damage found in hypertensive nephrosclerotic human patients. Human CKD patients (n = 2) show an increase in medullary (C) phosphorylated IRE1α and (D) CHOP staining (arrows) compared to non-CKD patients. Scale bars = 100 μm in (A–D).

Similar articles

Cited by

References

    1. Jha V. et al.. Chronic kidney disease: global dimension and perspectives. Lancet 382, 260–272 (2013). - PubMed
    1. Ojo A. Addressing the global burden of chronic kidney disease through clinical and translational research. Trans Am Clin Climatol Assoc 125, 229–243 (2014). - PMC - PubMed
    1. Dickhout J. G. & Krepinsky J. C. Endoplasmic reticulum stress and renal disease. Antioxid Redox Signal 11, 2341–2352 (2009). - PubMed
    1. Inagi R., Ishimoto Y. & Nangaku M. Proteostasis in endoplasmic reticulum--new mechanisms in kidney disease. Nat Rev Nephrol 10, 369–378 (2014). - PubMed
    1. Dickhout J. G., Carlisle R. E. & Austin R. C. Interrelationship between cardiac hypertrophy, heart failure, and chronic kidney disease: endoplasmic reticulum stress as a mediator of pathogenesis. Circ Res 108, 629–642 (2011). - PubMed

Publication types

MeSH terms