Review
. 2017 Jan 18:10:621.
doi: 10.3389/fnins.2016.00621. eCollection 2016.

Inner Hair Cell Loss Disrupts Hearing and Cochlear Function Leading to Sensory Deprivation and Enhanced Central Auditory Gain

Affiliations
Review

Inner Hair Cell Loss Disrupts Hearing and Cochlear Function Leading to Sensory Deprivation and Enhanced Central Auditory Gain

Richard Salvi et al. Front Neurosci. .

Abstract

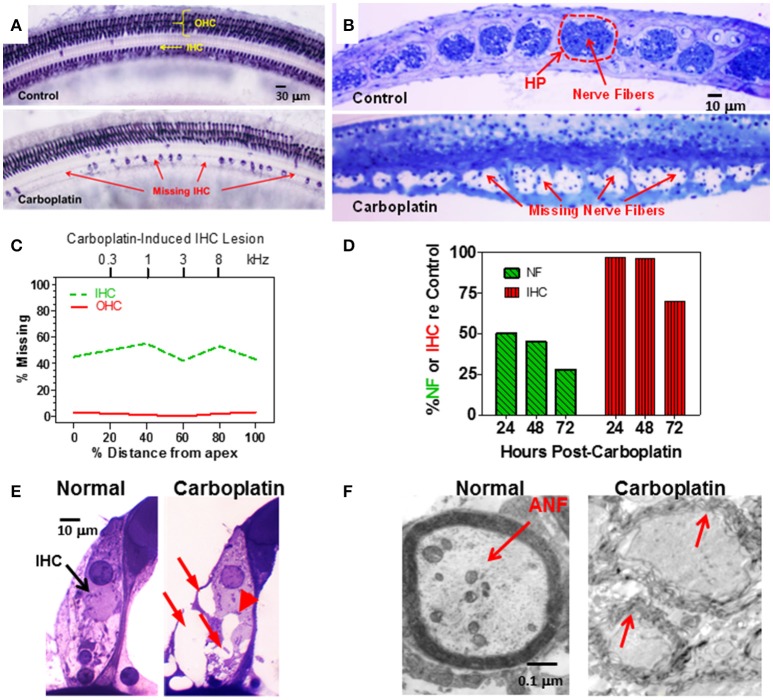
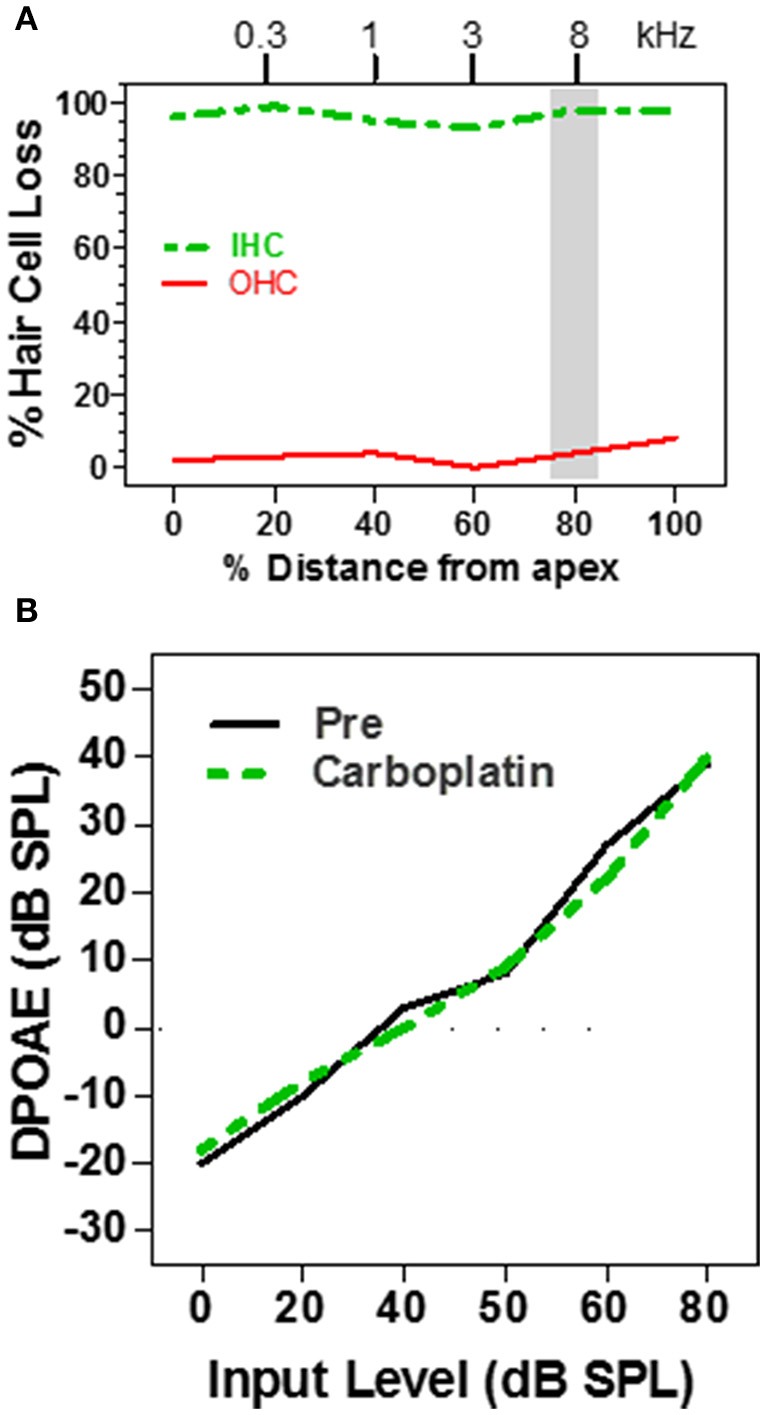
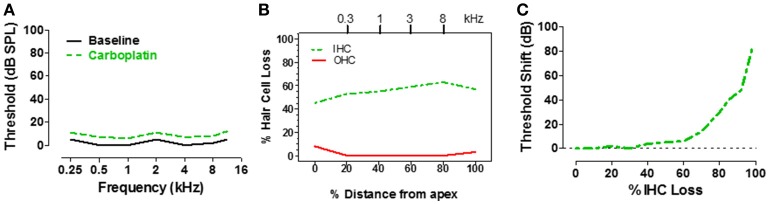
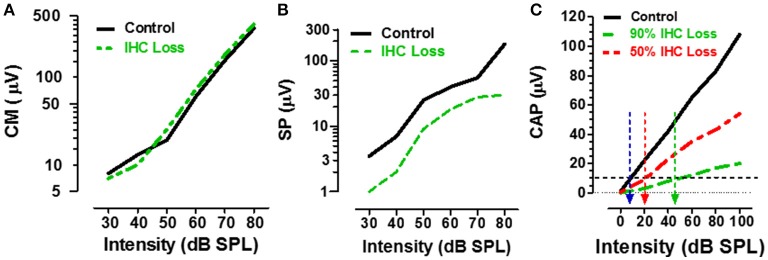
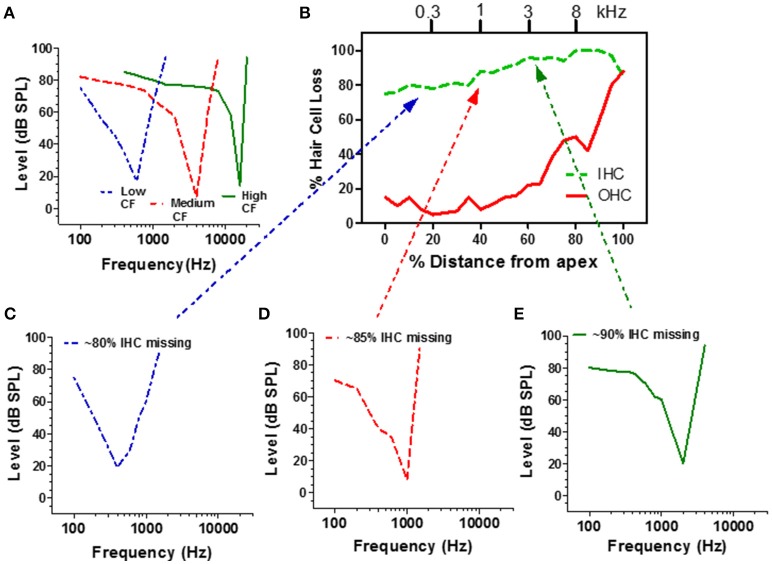
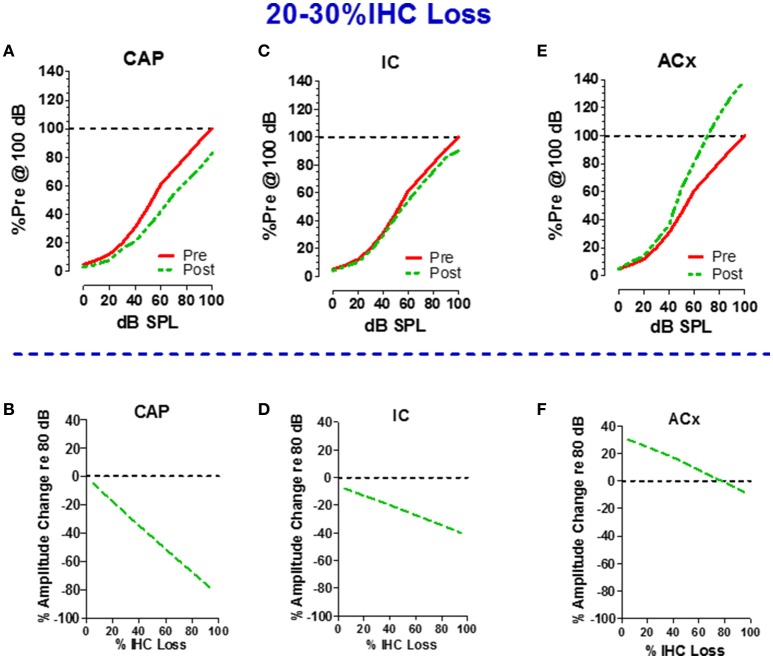
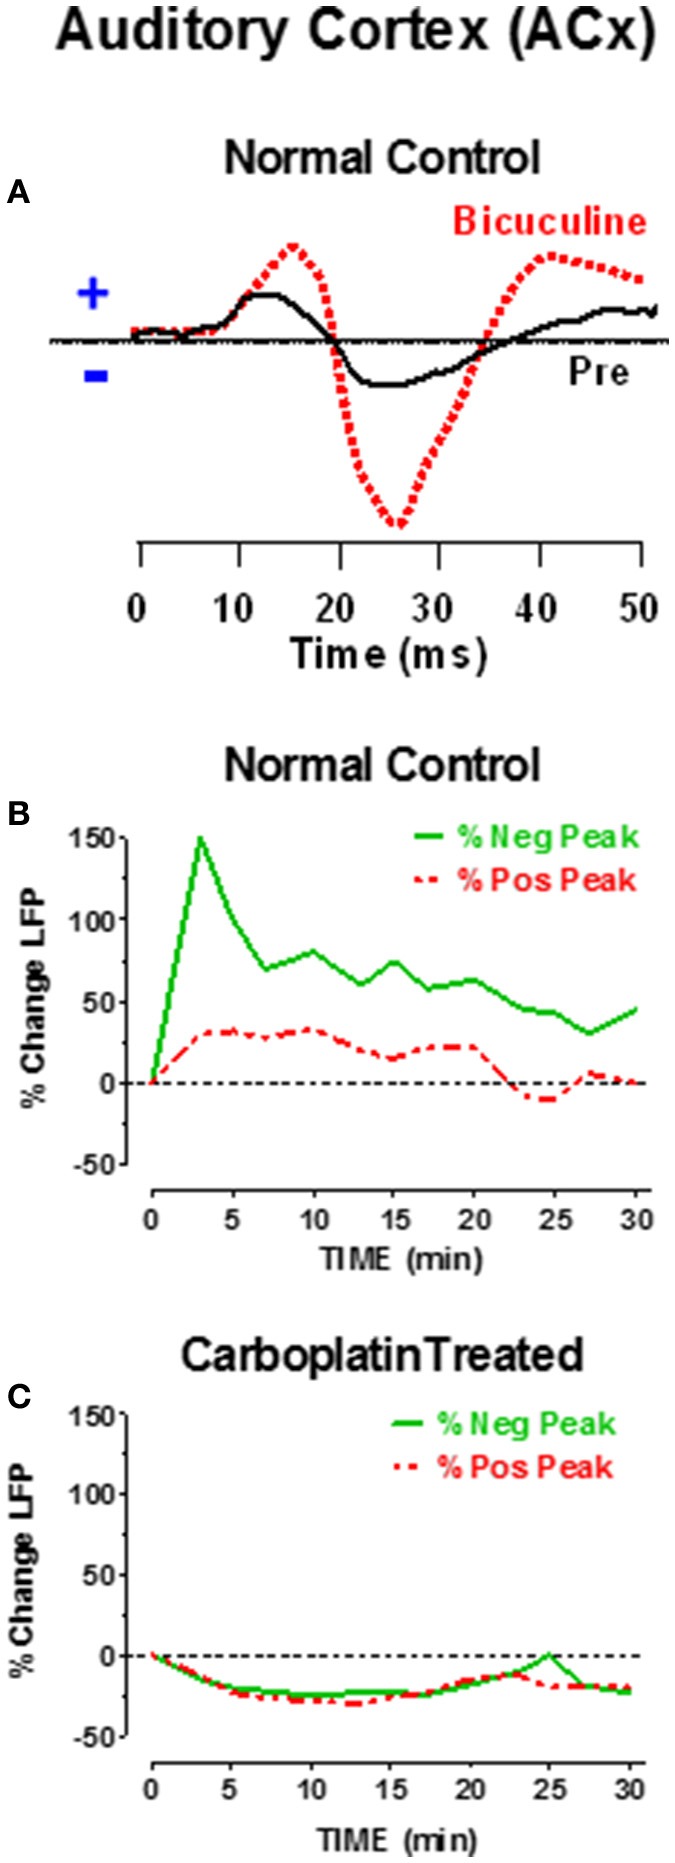
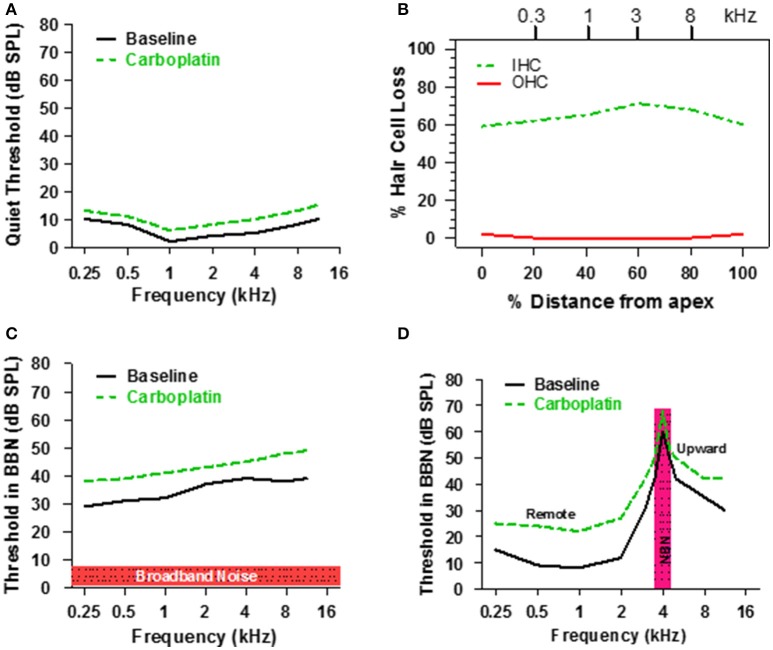
There are three times as many outer hair cells (OHC) as inner hair cells (IHC), yet IHC transmit virtually all acoustic information to the brain as they synapse with 90-95% of type I auditory nerve fibers. Here we review a comprehensive series of experiments aimed at determining how loss of the IHC/type I system affects hearing by selectively destroying these cells in chinchillas using the ototoxic anti-cancer agent carboplatin. Eliminating IHC/type I neurons has no effect on distortion product otoacoustic emission or the cochlear microphonic potential generated by OHC; however, it greatly reduces the summating potential produced by IHC and the compound action potential (CAP) generated by type I neurons. Remarkably, responses from remaining auditory nerve fibers maintain sharp tuning and low thresholds despite innervating regions of the cochlea with ~80% IHC loss. Moreover, chinchillas with large IHC lesions have surprisingly normal thresholds in quiet until IHC losses exceeded 80%, suggesting that only a few IHC are needed to detect sounds in quiet. However, behavioral thresholds in broadband noise are elevated significantly and tone-in-narrow band noise masking patterns exhibit greater remote masking. These results suggest the auditory system is able to compensate for considerable loss of IHC/type I neurons in quiet but not in difficult listening conditions. How does the auditory brain deal with the drastic loss of cochlear input? Recordings from the inferior colliculus found a relatively small decline in sound-evoked activity despite a large decrease in CAP amplitude after IHC lesion. Paradoxically, sound-evoked responses are generally larger than normal in the auditory cortex, indicative of increased central gain. This gain enhancement in the auditory cortex is associated with decreased GABA-mediated inhibition. These results suggest that when the neural output of the cochlea is reduced, the central auditory system compensates by turning up its gain so that weak signals once again become comfortably loud. While this gain enhancement is able to restore normal hearing under quiet conditions, it may not adequately compensate for peripheral dysfunction in more complex sound environments. In addition, excessive gain increases may convert recruitment into the debilitating condition known as hyperacusis.

Keywords: auditory cortex; auditory gain; carboplatin; central auditory system; hyperacusis; inner hair cells; tinnitus.


Figures

Figure 1
Figure 1
(A) Photomicrographs of a surface preparation of the organ of Corti stained with succinate dehydrogenase, a metabolic enzyme highly expressed in OHC and IHC, but not supporting cells. Control (upper panel) shows strong staining of all OHC and IHC. One month after a moderate dose of carboplatin (50–75 mg/kg, i.p.) there are patches of stained IHC separated by large regions of missing IHC. OHC were present and appeared normal. (B) Photomicrographs of thin sections stained with toluidine blue taken tangential to the habenula perforata. Dashed line (upper panel) showing the darkly stained nerve fibers in the openings in the habenular perforata (HP) in the osseous spiral lamina (dashed line) of a normal control ear. Each habenular opening in control ears is filled with nerve fibers (upper panel) whereas in carboplatin-treated ears (bottom panel), many nerve fibers are missing in the habenular openings. (C) Schematic of a cochleogram showing the typical pattern of IHC loss induced by a moderate dose of carboplatin. In this depiction, roughly 40–50% of the IHC were missing along the length of the cochlea whereas OHC were intact. The cochleogram shows the percentage of missing IHC and OHC as a function of percent distance from the apex of the cochlea; cochlear position related to frequency on the upper x-axis. (D) Carboplatin induced a large and rapid loss of nerve fibers (NF) in the habenula perforata 24–72 h post-treatment. Significant nerve fiber (NF) loss occurred 24 h post-treatment; IHC occurred several days later. (E) Photomicrographs illustrating the condition of the synaptic region at the base of the IHC of a normal control (left) and a carboplatin-treated animal (right). At 24 h post-treatment, many large vacuoles (red arrows) were observed at the afferent terminals of the carboplatin-treated chinchilla unlike the control. Swelling distorted the basal pole of the IHC in carboplatin treated (arrowhead) animal. (F) Transmission electron micrograph show thick myelin sheath around a normal auditory nerve fiber (ANF). Carboplatin caused significant demyelination 24–72 h post-treatment (red arrows). Data schematized from Hofstetter et al. (1997b), Ding et al. (1999, 2001), and Wang et al. (2003).
Figure 2
Figure 2
(A) Schematic cochleogram showing a very large IHC lesion with little OHC loss induced by a high dose of carboplatin. IHC lesion extends over nearly the entire length of the cochlea. (B) Schematic DPOAE input/output function before and after carboplatin treatment at f1 and f2 frequencies corresponding to the shaded region in the cochleogram in (A). DPOAE input/output function was normal several months post-carboplatin despite massive IHC loss, but retention of most OHC. Data schematized from Hofstetter et al. (1997a).
Figure 3
Figure 3
(A) Schematic of pure tone audiogram obtained pre- and post-carboplatin in a chinchilla with ~50–60% IHC and an intact OHC population (B). The post-carboplatin thresholds (green) were slightly increased from baseline (black). (B) Schematic of cochleogram showing 50–60% IHC and minimal OHC loss following carboplatin treatment (audiometric profile for such lesions depicted in A). Percent distance from the apex of cochlea shown on x-axis; position in the cochlea related to frequency on upper x-axis. (C) Schematic showing the approximate relationship between the threshold shift vs. the percent IHC loss induced by carboplatin. Thresholds remained nearly normal up to about 60% IHC loss, but then increased steeply once the IHC lesion exceeds 80%. Data schematized from Lobarinas et al. (2013).
Figure 4
Figure 4
(A) Schematic showing the CM input/output functions in control (black) vs. carboplatin-treated (green) chinchillas with large IHC loss but intact OHC. IHC loss had little effect on CM amplitude. (B) Schematic illustrating the SP input/output functions in control (black) vs. carboplatin-treated (green) chinchillas with large IHC lesion with retention of OHC. IHC lesion caused a large reduction (~60%) in SP amplitude. (C) Schematic showing the CAP input/output function in control (black) and carboplatin-treated chinchillas with a large (~90%, green) or moderate (~50%, red) IHC lesion and intact OHC. IHC loss resulted in a large decrease in CAP amplitude; the amplitude reduction was proportional to IHC loss. Black horizontal dashed line at 10 μV used to derive CAP threshold for control group (~10 dB SPL, blue arrow) vs. groups with 50% IHC loss (~20 dB SPL, red arrow) or 90% IHC loss (~45 dB SPL, green arrow). Data schematized from Trautwein et al. (1996), Wang et al. (1997), and Durrant et al. (1998).
Figure 5
Figure 5
(A) Schematic of a low, medium and high CF auditory nerve fiber frequency-threshold tuning curves. The neuron's CF maps to the tonotopic map of the cochlea (frequency-place map upper x-axis, B). (B) Schematic cochleogram showing the percentage of missing IHC and OHC in a chinchilla treated with a high dose of carboplatin that destroyed approximately 80–98% of the IHC; damage was more severe in the basal half of the cochlea. Carboplatin also damaged OHC in the base (60–100%). (C–E) Schematic of auditory nerve fiber tuning curves from carboplatin treated animals with CFs near 300 Hz (C, blue), 1000 Hz (D, red), and 3000 Hz (E, green). Dotted lines relate each neuron's CF to IHC damage on tonotopic map (upper x-axis, B). Data schematized from Wang et al. (1997).
Figure 6
Figure 6
Schematics in upper half illustrate the input/output functions recorded from the (A) round window of the cochlea (compound action potential, CAP), (C) inferior colliculus (IC) and (E) auditory cortex (ACx) before and after carboplatin treatment that induced 20–30% IHC loss. Amplitude of local field potentials (LFPs) expressed as a percentage of the pre-treatment amplitude measured at 100 dB SPL. All pre-treatment amplitudes equal 100% at 100 dB before carboplatin treatment. Schematics in lower half show the percent change in amplitude of the LFPs recorded at 80 dB SPL vs. percent IHC loss; plots show result for the cochlear CAP (B), IC (D), and ACx (F). Values above the dashed horizontal line in panel F indicate that at 80 dB SPL LFPs in the ACx were larger than normal for small to moderate size IHC lesion, but response were smaller than normal for IHC lesions >80%. Negative slopes indicate that LFP measured at 80 dB SPL decrease as IHC lesions increase. The decrease in amplitude was greatest for the CAP and least for the ACx. Data schematized from Qiu (1998) and Qiu et al. (2000).
Figure 7
Figure 7
(A) Schematic of sound-evoked local field potentials (LFPs) from the auditory cortex (ACx) before (pre, solid black line) and after applying bicuculline (dashed red line) to the surface of the ACx of a normal control. Note increase in positive and negative peaks in the ACx waveform; increase in negative peak was larger than positive peak. (B) Percent change in positive and negative peaks in the LFP after applying bicuculline to the ACx. Bicuculline caused a large increase in positive and negative peaks. Largest increase occurred approximately 5 min post-treatment. Amplitudes gradually recovered with bicuculline washout. (C) Percent change in LFP after applying bicuculline to the ACx of chinchillas that had been treated with a moderate dose of carboplatin 1–2 months earlier. Bicuculline failed to induce an increase in cortical LFP, but instead induced a small decrease in the LFP which partially recovered 30 min after applying bicuculline. Data schematized from Salvi et al. (2000a, 2014).
Figure 8
Figure 8
(A) Schematic illustrating threshold in quiet before and after a moderate dose of carboplatin. (B) Schematic representing the IHC and OHC loss after a moderate dose of carboplatin that induces a 60–70% IHC with little or no loss of OHC. (C) Schematic showing the threshold in 50 dB SPL broadband noise before and after moderate dose of carboplatin. (D) Schematic illustrating the thresholds measured in narrowband noise (100 Hz bandwidth) centered at 4 kHz before and after a moderate dose of carboplatin. Carboplatin-induced threshold elevations above 4 kHz reflect the upward spread of masking and those below 4 kHz reflect remote masking. Data schematized from Lobarinas et al. (2016).

References

    1. Abdala C., Sininger Y. S., Starr A. (2000). Distortion product otoacoustic emission suppression in subjects with auditory neuropathy. Ear Hear. 21, 542–553. 10.1097/00003446-200012000-00002 - DOI - PubMed
    1. Auerbach B. D., Rodrigues P. V., Salvi R. J. (2014). Central gain control in tinnitus and hyperacusis. Front. Neurol. 5:206. 10.3389/fneur.2014.00206 - DOI - PMC - PubMed
    1. Boettcher F., Gratton M. A., Bancroft B. R., Spongr V. (1992). Interaction of noise and other agents, in Noise Induced Hearing Loss, eds Dancer A., Henderson D., Salvi R., Hamernik R. P. (St. Louis, MO: Mosby Year Book; ), 175–187.
    1. Brotherton H., Plack C. J., Maslin M., Schaette R., Munro K. J. (2015). Pump up the volume: could excessive neural gain explain tinnitus and hyperacusis? Audiol. Neurootol. 20, 273–282. 10.1159/000430459 - DOI - PubMed
    1. Brown A. M., McDowell B., Forge A. (1989). Acoustic distortion products can be used to monitor the effects of chronic gentamicin treatment. Hear. Res. 42, 143–156. 10.1016/0378-5955(89)90140-8 - DOI - PubMed

LinkOut - more resources