. 2017 Jan 25;3(1):81-91.
doi: 10.1021/acscentsci.6b00353. Epub 2016 Dec 19.

Illuminating Phenylazopyridines To Photoswitch Metabotropic Glutamate Receptors: From the Flask to the Animals

Affiliations

Illuminating Phenylazopyridines To Photoswitch Metabotropic Glutamate Receptors: From the Flask to the Animals

Xavier Gómez-Santacana et al. ACS Cent Sci. .

Abstract

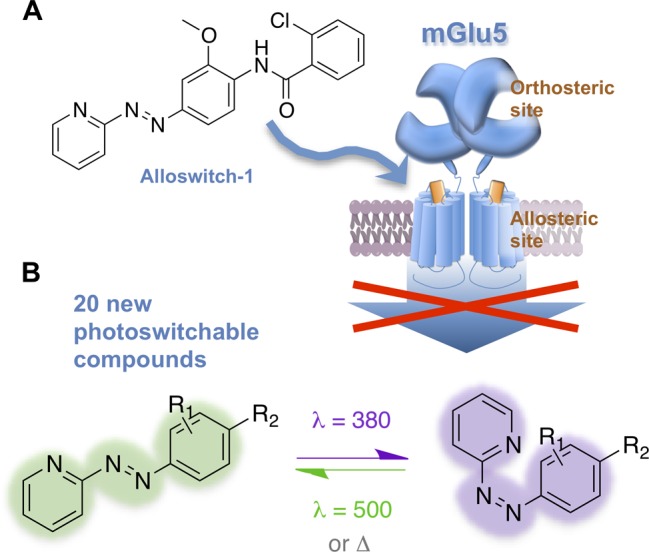
Phenylazopyridines are photoisomerizable compounds with high potential to control biological functions with light. We have obtained a series of phenylazopyridines with light dependent activity as negative allosteric modulators (NAM) of metabotropic glutamate receptor subtype 5 (mGlu5). Here we describe the factors needed to achieve an operational molecular photoisomerization and its effective translation into in vitro and in vivo receptor photoswitching, which includes zebrafish larva motility and the regulation of the antinociceptive effects in mice. The combination of light and some specific phenylazopyridine ligands displays atypical pharmacological profiles, including light-dependent receptor overactivation, which can be observed both in vitro and in vivo. Remarkably, the localized administration of light and a photoswitchable compound in the peripheral tissues of rodents or in the brain amygdalae results in an illumination-dependent analgesic effect. The results reveal a robust translation of the phenylazopyridine photoisomerization to a precise photoregulation of biological activity.


Conflict of interest statement

The authors declare no competing financial interest.

Figures

Figure 1
Figure 1
Design of the phenylazopyridine series. (A) Alloswitch-1 is a photoswitchable allosteric inverse agonist of mGlu5, in its trans configuration. (B) We designed and synthesized 20 photoswitchable derivatives of alloswitch-1, with the same phenylazopyridine scaffold. With violet light (380 nm) they switch from the thermodynamically stable trans isomer to the cis isomer and switch back to the trans isomer with green light (500 nm) or thermally, without illumination.
Chart 1
Chart 1. mGlu5 NAMs with 2-Arylethynylpyridine, SIB-1757, and Fenobam
Figure 2
Figure 2
Spectroscopic and photosiomerization properties. (A, B) Distribution of wavelengths of absorption in the UV–vis spectrum of compounds in the series, detected by HPLC-PDA-MS (see Supporting Information). Maximum of the band corresponding to (A) π–π* transition for the trans isomers and (B) n−π* transition for the cis isomers. (C) Example of UV–vis absorption spectra corresponding to compound 3c, 25 μM in DMSO. The black line corresponds to the initial spectrum in dark conditions, the violet line to the spectrum after illumination at 380 nm, and the green line after illumination at 500 nm. Comparison of these curves with the spectra of pure trans and cis isomers, obtained from HPLC-PDA-MS analysis (see Supporting Information), results in a full conversion from trans to cis isomer and near complete back-isomeration from cis to trans isomer. (D) Distribution of photoisomerization scores (PIS) for phenylazopyridines under illumination at 380 nm (violet bars) and at 500 nm (green bars) (see text and Supporting Information).
Figure 3
Figure 3
Pharmacological properties. (A) Distribution of compounds with the IC50 values obtained with an IP accumulation assay, with fenobam as the control. Approximately one-half of the compounds have potencies in the nanomolar range in dark conditions, and most of the compounds are more potent than fenobam (IC50 = 1.6 μM). (B) Distribution of compounds with the photoinduced potency shift (PPS) for the phenylazopyridines tested (see text). (C) IP accumulation dose–response curve of compound 6 with 100 nM of quisqualate in dark conditions (black), under illumination at 380 nm (dark violet), under illumination at 400 nm (bright violet). Gray curves correspond to the inverse agonist control (fenobam). (D) Percentage of activation of the mGlu5 receptor with 10 μM 6 and 100 nM quisqualate. Analysis of variance (one-way ANOVA with Šidák correction for multiple comparisons; **p < 0.01, ****p < 0.0001) showed significant differences between dark bar and 380 nm values, and also of 400 nm values with both dark and 380 nm values.
Figure 4
Figure 4
Calcium imaging in individual cells illustrates the light-dependency of mGlu5 inhibition by compounds 1f and 3c. (A, B) Fluorescence ratio (F340/F380) over time of calcium indicator Fura-2 loaded in mGlu5-expressing HEK293 cells. Cells were challenged with an mGlu5 agonist (ago, gray line, 3 μM quisqualate), 1 μM 3c (A) or 1 μM 1f (B) (black lines), and different illumination wavelengths (six, ranging between 370 and 500 nm) indicated by color boxes and corresponding numbers above. (C, D) Quantification of the light-induced receptor activity in the presence of 3c (C) or 1f (D) at indicated illumination wavelengths. Data are presented as mean ± SEM of the normalized calcium oscillation frequency. The frequency of calcium oscillations during an illumination period (5 min) was calculated as number of oscillations per minute, and normalized to the initial response to the agonist. Peak, half-width at half-maximum (HWHM), and maximum (Max) values were inferred by fitting the data shown in the graph to a Gaussian function (magenta curve).
Figure 5
Figure 5
Summary of wavelength–activity relationships in single-cell experiments. In the left graph, magenta bars indicate the illumination wavelength (peak) at which the maximum light-induced receptor activity is obtained for the compounds indicated. White bars represent the range of wavelengths at which the light-induced activity is equal to half the maximum response or more (half-width at half-maximum, HWHM). The maximum amplitude of the light-induced receptor activity is reported in the graph on the right, and expressed as times the response to agonist of the naive receptors. These three parameters (peak, HWHM, and maximum) describe the Gaussian fitting performed for all compounds on the original data from single-cell experiments, as exemplified for 1f and 3c in Figure 4C,D. Original data were obtained from calcium imaging experiments in individual cells (done as described in Figure 4A,B).
Figure 6
Figure 6
In vivo screening in 7-day-old zebrafish larvae. (A) Integration of free-swimming distances in the dark during 5 and 25 min after the administration of compounds 1al, 2b,c and 47 to afford a 10 μM concentration in the medium, extracted from individual plots (Supporting Information). Values correspond to the mean and the SEM of the behavior of 30 animals minimum. Analysis of variance showed statistically significant differences of the responses of some compounds with respect to vehicle. Values correspond to the mean and the SEM of the behavior of 30 animals minimum. (B) In the dark, compounds 1a and 1f decreased the motility of zebrafish 30 min after compound administration (10 μM) to an extent similar to that of 2-BisPEB. The free-swimming distances were integrated every 5 min during 30 min. Fenobam had a weak nonsignificant effect when compared to vehicle. Values correspond to the mean and the SEM of the behavior of 30 animals minimum. Analysis of variance (two-way (compound, time) ANOVA with time as repeated measure and including the Šidák correction for multiple testing; *p < 0.05, **p < 0.01, ***p < 0.001, ****p < 0.0001). (C) Effect of light/dark cycles. Compounds 1a and 1f at 10 μM inhibit animal motility similarly to 2-bisPEB in the dark (gray background), whereas under violet light (violet background) fish treated with 1f recover a similar behavior to vehicle treated controls (blue line). Zebrafish larvae treated with 1a experience an increase of their normal motility under violet light (red line). In the figure we show the light/dark cycles from 4 to 12 min. Values correspond to the mean and the SEM of the behavior of 24 animals minimum. (D) In vivo photoswitching efficacy of compounds 1al, 2b,c, and 47 with the corresponding variance analysis. Each bar corresponds to the mean of the sum of the free swimming distances in all the dark or violet illuminated points for each experiment (4 experiments with 6 animals per experiment) subtracting the corresponding sum of distances of the 2-BisPEB-treated animals and normalizing the distances by the lower distance mean of the set (0%) and the mean corresponding to the vehicle-treated animals (100%). The subtraction of the 2-BisPEB effect was done to minimize the effect of the light not corresponding to the effect of the administered compounds. The error bars correspond to the associated SEM. Analysis of variance (two-way (compound, light conditions) ANOVA with light conditions as a repeated measure and including the Šidák correction for multiple comparisons; *p < 0.05, **p < 0.01, ***p < 0.001, ****p < 0.0001).
Figure 7
Figure 7
Photoswitching of pain-like behavior in mice. (A) Local photoswitching in the mouse hindpaw. The mouse hindpaw was injected with vehicle (20% DMSO + 20% Tween-80 in saline), 5 mM raseglurant (Rasegl.), 5 mM compound 1e or 5 mM compound 1f and then illumination at 405 nm (or dark) during 15 min was performed (n = 6 for each condition). Subsequently, the total hindpaw licking (in seconds) was measured during 5 min after the intraplantar injection of formalin solution (2.5% paraformaldehyde). The scheme of the protocol used is depicted in the upper inset. Analysis of variance (one-way ANOVA with Šidák correction for multiple comparisons; **p < 0.01, ***p < 0.001) showed significant differences between dark and 405 nm values for phenylazopyridines 1e and 1f, but not for vehicle and raseglurant. (B) Local photoswitching in mouse amygdala. Persistent inflammatory pain was induced by unilateral intraplantar injection of 30 μL of complete Freund’s adjuvant (CFA) in the left hind paw. Mechanical allodynia was measured by stimulating the CFA-treated hindpaw with a 1.4 g von Frey filament after intra-amygdala injection of vehicle (0.003% DMSO in PBS, n = 11) or compound 1a (300 nM, n = 13) in dark condition and with amygdala illumination at 385 nm. Naive-mouse mechanical sensitivity was measured before CFA injection (n = 11). The scheme of the protocol used is also depicted in the upper inset. Analysis of variance (one-way ANOVA with Šidák correction for multiple comparisons; ****p < 0.0001) showed significant differences between dark and 385 nm values for 1a but not for vehicle and showed nonsignificant differences between the naive mice and those treated with 1a with no illumination.

References

    1. Drews J. Drug discovery: a historical perspective. Science 2000, 287, 1960–1964. 10.1126/science.287.5460.1960. - DOI - PubMed
    1. Hay M.; Thomas D. W.; Craighead J. L.; Economides C.; Rosenthal J. Clinical development success rates for investigational drugs. Nat. Biotechnol. 2014, 32, 40–51. 10.1038/nbt.2786. - DOI - PubMed
    1. Paul S. M.; Mytelka D. S.; Dunwiddie C. T.; Persinger C. C.; Munos B. H.; Lindborg S. R.; Schacht A. L. How to improve R&D productivity: the pharmaceutical industry’s grand challenge. Nat. Rev. Drug Discovery 2010, 9, 203–214. 10.1038/nrd3078. - DOI - PubMed
    1. Kramer R. H.; Mourot A.; Adesnik H. Optogenetic pharmacology for control of native neuronal signaling proteins. Nat. Neurosci. 2013, 16, 816–823. 10.1038/nn.3424. - DOI - PMC - PubMed
    1. Velema W. A.; Szymanski W.; Feringa B. L. Photopharmacology: beyond proof of principle. J. Am. Chem. Soc. 2014, 136, 2178–2191. 10.1021/ja413063e. - DOI - PubMed