. 2017:1558:395-413.
doi: 10.1007/978-1-4939-6783-4_19.

Mapping Biological Networks from Quantitative Data-Independent Acquisition Mass Spectrometry: Data to Knowledge Pipelines

Affiliations

Mapping Biological Networks from Quantitative Data-Independent Acquisition Mass Spectrometry: Data to Knowledge Pipelines

Erin L Crowgey et al. Methods Mol Biol. 2017.

Abstract

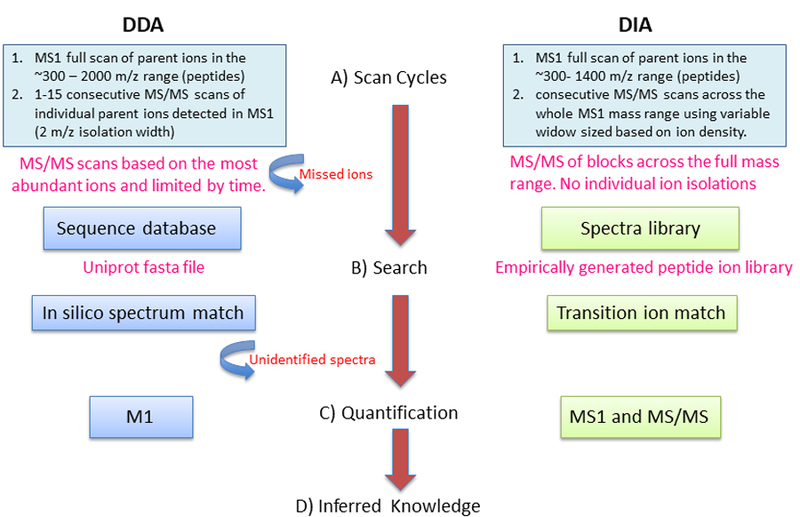
Data-independent acquisition mass spectrometry (DIA-MS) strategies and applications provide unique advantages for qualitative and quantitative proteome probing of a biological sample allowing constant sensitivity and reproducibility across large sample sets. These advantages in LC-MS/MS are being realized in fundamental research laboratories and for clinical research applications. However, the ability to translate high-throughput raw LC-MS/MS proteomic data into biological knowledge is a complex and difficult task requiring the use of many algorithms and tools for which there is no widely accepted standard and best practices are slowly being implemented. Today a single tool or approach inherently fails to capture the full interpretation that proteomics uniquely supplies, including the dynamics of quickly reversible chemically modified states of proteins, irreversible amino acid modifications, signaling truncation events, and, finally, determining the presence of protein from allele-specific transcripts. This chapter highlights key steps and publicly available algorithms required to translate DIA-MS data into knowledge.

Keywords: Citrullination; Data-independent acquisition; Phosphorylation; Post-translational modifications; Protein networks; SWATH.


Figures

Figure 1.
Figure 1.. Data Dependent Acquisition Mass Spectrometry vs. Data Independent Acquisition Mass Spectrometry
(A) Scan Cycles: DDA, only fragment ion (MS/MS) spectra for selected precursor ions detectable in a survey (MS1) scan are generated. DIA, fragment ion spectra (MS/MS) for all the analytes detectable within the m/z precursor range are recorded. (B) Search: DDA, fragment ion spectra are assigned to their corresponding peptide sequences by seqeunce database seraching. DIA analysis are based on targeted data extraction, in which peptide ions from a spectral library are queried against experimental data to find the best matching fragment ion masses and respective intesnities. (C) Quantification: DDA, peptides (and then proteins) are quantified using MS1 signal or spectral counts. DIA computes protein abundance based on selection of transition ion from MS/MS spectra. (D)Translation of large scale peptide/proteins quantified into knowledge.
Figure 2:
Figure 2:. Dowload Cytoscape and Install Plugins.
(1) Cytoscape is open-source application that can be downloaded from http://www.cytoscape.org. The application is free and avialable for Mac or Windows. The application requires Java, which is also freely avialable: http://www.oracle.com/technetwork/java/javase/downloads/jre8-downloads-2133155.html (2) Install Plugins. Step 1: Open cytoscape and click on the Apps tab. This will cause the App Manager to appear. Step 2: Type in the search bar the name of the application of interest. Step 3: select the application of interest and click on install.
Figure 3:
Figure 3:. Overview of ReactomeFI Plugin.
Step 1: Click on the apps tab and application installed (following Figure 2) will appear. Step 2: Select the application of intersted (i.e. reactomeFI). Step 3: Select the type of analysis to execute.
Figure 4:
Figure 4:. ReactomeFI Analysis of the Top Citrullinated Proteins in Heart Diseases.
The top citrullinated proteins for [ref] were up-loaded and analyzed in cytoscape via reactomeFI. Circles nodes represent proteins that were differentially citrullinated, whereas triangle nodes represent proteins that were not reported as having differenitally citrullinated residues, but are linked to proteins, through protein-protein interactions (grey lines) that do have differentially regulated citrullinated residues. The top 3 pathways enriched per module were extracted. Module 1: Striated muscle contraction, hypertrophic cardiomyopathy, and dilated cardiomyopathy. Module 2: glycolysis/gluconeogenesis. Biosynthesis of amino acids, and validated targets of c-myc transcriptional activation. Module 3: Parkinson’s disease, The citric acid cycle and respiratory electron transport, and Huntington disease. Module 4: Tyrosine metabolism, Fatty acid degradation, and retinol metabolism. Module 5: The citric acid (TCA) cycle and respiratory electron transport, carbon metabolism, and metabolic pathway.
Figure 5:
Figure 5:. ClusterONE Analysis of an Interacome.
The network in Figure 2 was further analyzed in cytoscape using ClusterONE. Orange triangles are nodes that represent proteins that are highly connected within and across modules. Red squares are nodes that were clustered, whereas grey circles are outliers. The top cluster consisted of 8 proteins: COL6A3, ACTN2, ACTN3, ITGAV, VIM, TNNT2, MYBPC3, and TNNI3 (p-value 0.001, density 0.714, quality 0.625).
Figure 6:
Figure 6:. Overview for Executing a BiNGO Analysis.
Step 1: Enter the name of the analysis and select either ‘Get Cluster from Network’ or ‘Paste Genes from Text’. Step 2: Select over or under-representation, select a staitsitcal test (i.e. hypergeometric), slect a multiple testing correction (i.e. Benjamini & Hochberg False Discovery Rate (FDR) correction, a signficance level, the categories to be visualized, reference set, and ontology type (Biological Process, Molecular Function, or Cellular Compartment). Step 3: Select the appropriate species and Start BiNGO analysis.
Figure 7:
Figure 7:. Gene Ontology (Molecular Function) Enrichment Analysis Using Bingo.
The top citrullination proteins from [36] were up-loaded into Bingo and analyzed for enriched molecular function ontologies. Orange nodes represent the most significantly enriched gene ontology terms, whereas white and yellow represent the least significantly enriched gene ontology terms. The Bingo analysis highlights the hierarchic of the ontologies. For this dataset the most enriched Molecular Function terms were: hydro-lyase activity, carbon-oxygen lyase activity, oxidoreductase activity, NAD or NADH binding, lyase activity, troponin C binding, and enoyl-CoA hydratase activity.

Similar articles

Cited by

References

    1. Bantscheff M, Lemeer S, Savitski MM, Kuster B (2012) Quantitative mass spectrometry in proteomics: critical review update from 2007 to the present. Anal Bioanal Chem 404:939–965. 10.1007/s00216-012-6203-4 - DOI - PubMed
    1. Aebersold R, Mann M (2003) Mass spectrometry-based proteomics. Nature 422:198–207. 10.1038/nature01511 - DOI - PubMed
    1. Zhang Y, Fonslow BR, Shan B, et al. (2013) Protein Analysis by Shotgun/Bottom-up Proteomics. Chem Rev 113:2343–2394. 10.1021/cr3003533 - DOI - PMC - PubMed
    1. Nesvizhskii AI (2007) Protein identification by tandem mass spectrometry and sequence database searching. Methods Mol Biol 367:87–119. 10.1385/1-59745-275-0:87 - DOI - PubMed
    1. Bateman NW, Goulding SP, Shulman NJ, et al. (2014) Maximizing Peptide Identification Events in Proteomic Workflows Using Data-Dependent Acquisition (DDA). Mol {&} Cell Proteomics 13:329–338. 10.1074/mcp.M112.026500 - DOI - PMC - PubMed

LinkOut - more resources