

Multimodal optical analysis discriminates freshly extracted human sample of gliomas, metastases and meningiomas from their appropriate controls
- PMID: 28150726
- PMCID: PMC5288720
- DOI: 10.1038/srep41724
Multimodal optical analysis discriminates freshly extracted human sample of gliomas, metastases and meningiomas from their appropriate controls
Abstract
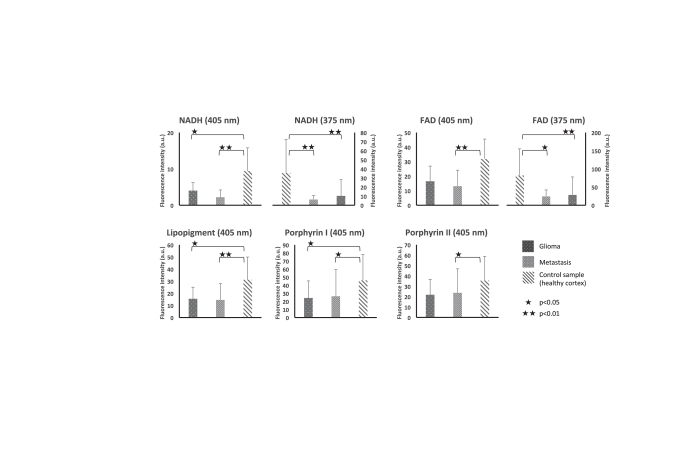
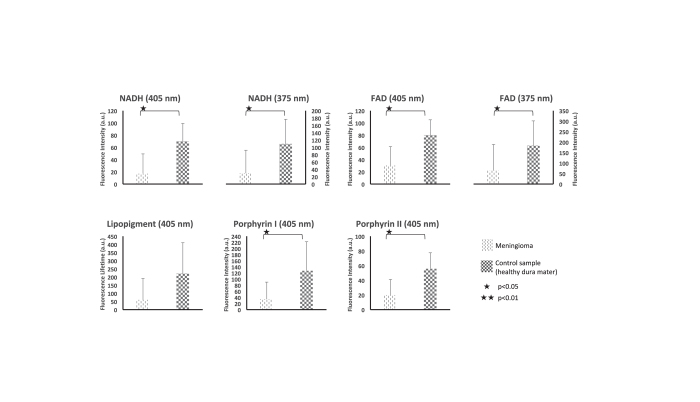
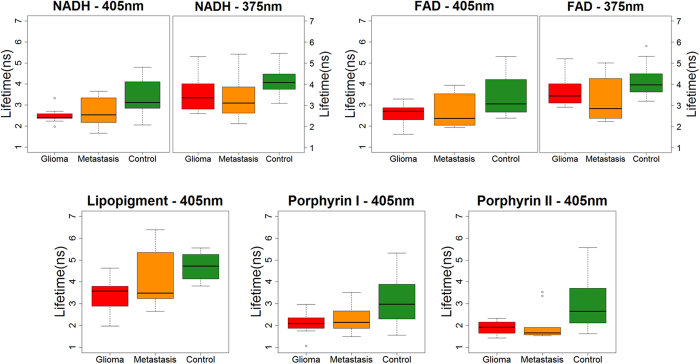
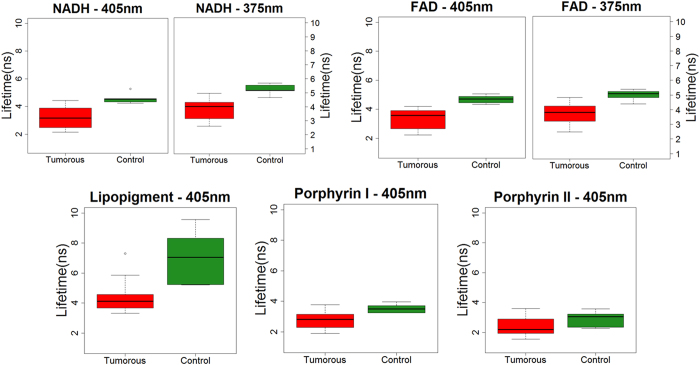
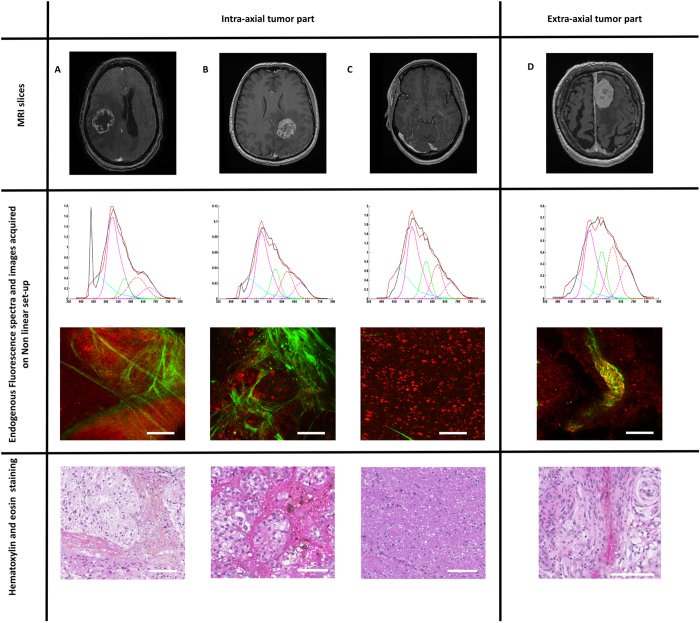
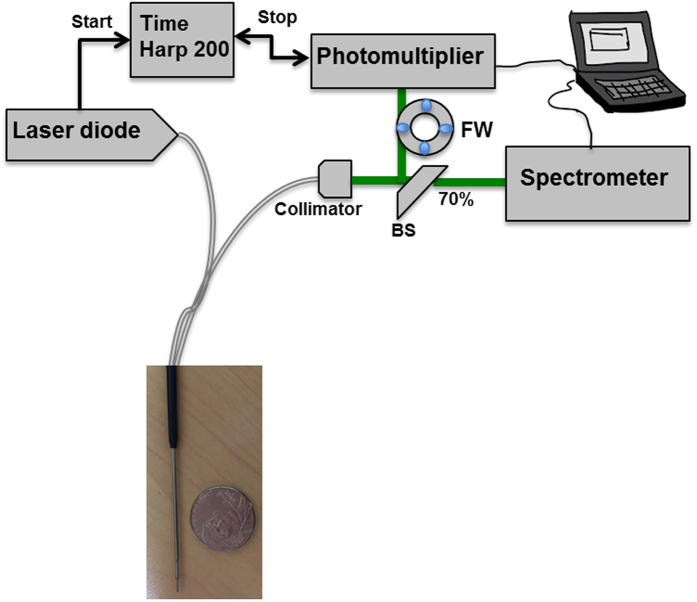
Delineating tumor margins as accurately as possible is of primordial importance in surgical oncology: extent of resection is associated with survival but respect of healthy surrounding tissue is necessary for preserved quality of life. The real-time analysis of the endogeneous fluorescence signal of brain tissues is a promising tool for defining margins of brain tumors. The present study aims to demonstrate the feasibility of multimodal optical analysis to discriminate fresh samples of gliomas, metastases and meningiomas from their appropriate controls. Tumor samples were studied on an optical fibered endoscope using spectral and fluorescence lifetime analysis and then on a multimodal set-up for acquiring spectral, one and two-photon fluorescence images, second harmonic generation signals and two-photon fluorescence lifetime datasets. The obtained data allowed us to differentiate healthy samples from tumor samples. These results confirmed the possible clinical relevance of this real-time multimodal optical analysis. This technique can be easily applied to neurosurgical procedures for a better delineation of surgical margins.
Conflict of interest statement
The authors declare no competing financial interests.
Figures
Similar articles
-
Optical Signatures Derived From Deep UV to NIR Excitation Discriminates Healthy Samples From Low and High Grades Glioma.Sci Rep. 2019 Jun 19;9(1):8786. doi: 10.1038/s41598-019-45181-4. Sci Rep. 2019. PMID: 31217542 Free PMC article.
-
Multimodal optical analysis of meningioma and comparison with histopathology.J Biophotonics. 2017 Feb;10(2):253-263. doi: 10.1002/jbio.201500251. Epub 2016 Feb 12. J Biophotonics. 2017. PMID: 26871683
-
Multimodal imaging to explore endogenous fluorescence of fresh and fixed human healthy and tumor brain tissues.J Biophotonics. 2019 Mar;12(3):e201800178. doi: 10.1002/jbio.201800178. Epub 2018 Oct 23. J Biophotonics. 2019. PMID: 30203459
-
Molecular changes tracking through multiscale fluorescence microscopy differentiate Meningioma grades and non-tumoral brain tissues.Sci Rep. 2021 Feb 15;11(1):3816. doi: 10.1038/s41598-020-78678-4. Sci Rep. 2021. PMID: 33589651 Free PMC article.
-
Fluorescence image-guided neurosurgery.Future Oncol. 2017 Nov;13(26):2341-2348. doi: 10.2217/fon-2017-0194. Epub 2017 Nov 10. Future Oncol. 2017. PMID: 29121788 Review.
Cited by
-
Spectral complexity of 5-ALA induced PpIX fluorescence in guided surgery: a clinical study towards the discrimination of healthy tissue and margin boundaries in high and low grade gliomas.Biomed Opt Express. 2019 Apr 18;10(5):2478-2492. doi: 10.1364/BOE.10.002478. eCollection 2019 May 1. Biomed Opt Express. 2019. PMID: 31149380 Free PMC article.
-
Label-free and noninvasive method for assessing the metabolic status in type 2 diabetic rats with myocardium diastolic dysfunction.Biomed Opt Express. 2020 Dec 17;12(1):480-493. doi: 10.1364/BOE.413347. eCollection 2021 Jan 1. Biomed Opt Express. 2020. PMID: 33659084 Free PMC article.
-
Comparative Study Between a Customized Bimodal Endoscope and a Benchtop Microscope for Quantitative Tissue Diagnosis.Front Oncol. 2022 May 12;12:881331. doi: 10.3389/fonc.2022.881331. eCollection 2022. Front Oncol. 2022. PMID: 35686105 Free PMC article.
-
Optical Signatures Derived From Deep UV to NIR Excitation Discriminates Healthy Samples From Low and High Grades Glioma.Sci Rep. 2019 Jun 19;9(1):8786. doi: 10.1038/s41598-019-45181-4. Sci Rep. 2019. PMID: 31217542 Free PMC article.
-
Miniature, multi-dichroic instrument for measuring the concentration of multiple fluorophores.Biomed Opt Express. 2024 Mar 14;15(4):2377-2391. doi: 10.1364/BOE.516574. eCollection 2024 Apr 1. Biomed Opt Express. 2024. PMID: 38633072 Free PMC article.
References
-
- Ba J. L., Jandial R., Nesbit A., Badie B. & Chen M. Current and emerging treatments for brain metastases. Oncol. Williston Park N 29, 250–257 (2015). - PubMed
-
- Kubben P. L. et al.. Intraoperative MRI-guided resection of glioblastoma multiforme: a systematic review. Lancet Oncol. 12, 1062–1070 (2011). - PubMed
-
- Uluç K., Kujoth G. C. & Başkaya M. K. Operating microscopes: past, present, and future. Neurosurg. Focus 27, E4 (2009). - PubMed
Publication types
MeSH terms
LinkOut - more resources
Full Text Sources
Other Literature Sources
