

Selective binocular vision loss in two subterranean caviomorph rodents: Spalacopus cyanus and Ctenomys talarum
- PMID: 28150809
- PMCID: PMC5288697
- DOI: 10.1038/srep41704
Selective binocular vision loss in two subterranean caviomorph rodents: Spalacopus cyanus and Ctenomys talarum
Abstract
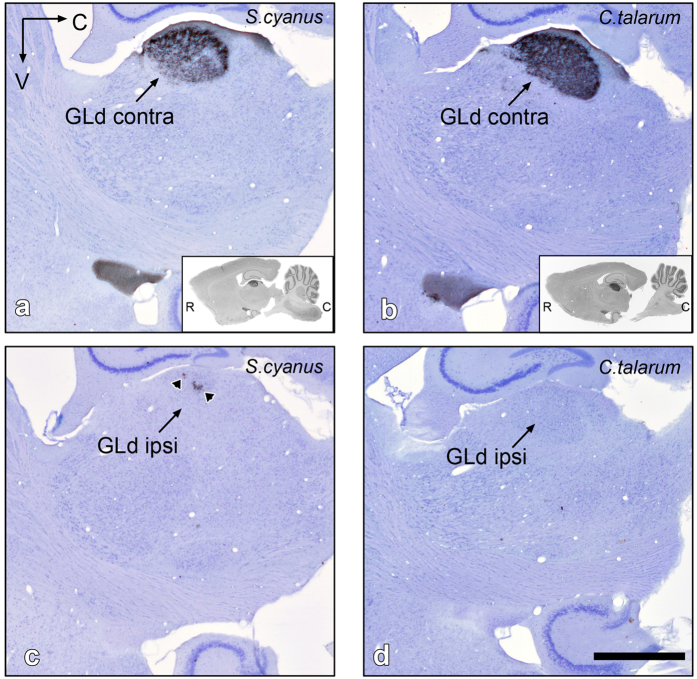
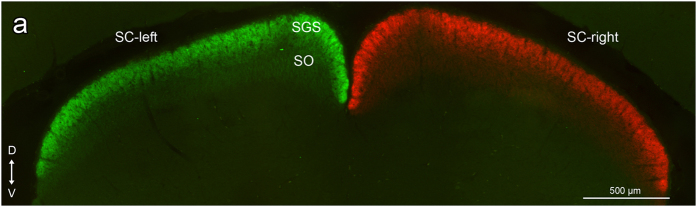
To what extent can the mammalian visual system be shaped by visual behavior? Here we analyze the shape of the visual fields, the densities and distribution of cells in the retinal ganglion-cell layer and the organization of the visual projections in two species of facultative non-strictly subterranean rodents, Spalacopus cyanus and Ctenomys talarum, aiming to compare these traits with those of phylogenetically closely related species possessing contrasting diurnal/nocturnal visual habits. S. cyanus shows a definite zone of frontal binocular overlap and a corresponding area centralis, but a highly reduced amount of ipsilateral retinal projections. The situation in C. talarum is more extreme as it lacks of a fronto-ventral area of binocular superposition, has no recognizable area centralis and shows no ipsilateral retinal projections except to the suprachiasmatic nucleus. In both species, the extension of the monocular visual field and of the dorsal region of binocular overlap as well as the whole set of contralateral visual projections, appear well-developed. We conclude that these subterranean rodents exhibit, paradoxically, diurnal instead of nocturnal visual specializations, but at the same time suffer a specific regression of the anatomical substrate for stereopsis. We discuss these findings in light of the visual ecology of subterranean lifestyles.
Conflict of interest statement
The authors declare no competing financial interests.
Figures


Similar articles
-
The visual system of the Florida garfish, Lepisosteus platyrhincus (Ginglymodi). IV. Bilateral projections and the binocular visual field.Brain Behav Evol. 1995;45(1):34-53. doi: 10.1159/000113384. Brain Behav Evol. 1995. PMID: 7866770
-
Does nocturnality drive binocular vision? Octodontine rodents as a case study.PLoS One. 2013 Dec 31;8(12):e84199. doi: 10.1371/journal.pone.0084199. eCollection 2013. PLoS One. 2013. PMID: 24391911 Free PMC article.
-
Eye and vision in the subterranean rodent cururo (Spalacopus cyanus, Octodontidae).J Comp Neurol. 2005 Jun 6;486(3):197-208. doi: 10.1002/cne.20491. J Comp Neurol. 2005. PMID: 15844175
-
Visual system of a naturally microphthalmic mammal: the blind mole rat, Spalax ehrenbergi.J Comp Neurol. 1993 Feb 15;328(3):313-50. doi: 10.1002/cne.903280302. J Comp Neurol. 1993. PMID: 8440785 Review.
-
The visual system in subterranean African mole-rats (Rodentia, Bathyergidae): retina, subcortical visual nuclei and primary visual cortex.Brain Res Bull. 2008 Mar 18;75(2-4):356-64. doi: 10.1016/j.brainresbull.2007.10.055. Epub 2007 Nov 26. Brain Res Bull. 2008. PMID: 18331898 Review.
Cited by
-
A specialized reciprocal connectivity suggests a link between the mechanisms by which the superior colliculus and parabigeminal nucleus produce defensive behaviors in rodents.Sci Rep. 2020 Oct 1;10(1):16220. doi: 10.1038/s41598-020-72848-0. Sci Rep. 2020. PMID: 33004866 Free PMC article.
References
-
- Nevo E. Mammalian evolution underground. The ecological-genetic-phenetic interfaces. Acta Theriol. (Warsz). 40, 9–31 (1995).
-
- Begall S., Burda H. & Schleich C. E. Subterranean rodents: News from underground. (Springer-Verlag Berlin Heidelberg, 2007).
-
- Tobler I. et al.. Rest-activity rhythm of the blind mole rat Spalax ehrenbergi under different lighting conditions. Behav. Brain Res. 96, 173–183 (1998). - PubMed
-
- Oosthuizen M. K., Cooper H. M. & Bennett N. C. Circadian rhythms of locomotor activity in solitary and social species of African mole-rats (family: Bathyergidae). J. Biol. Rhythms 18, 481–490 (2003). - PubMed
Publication types
MeSH terms
LinkOut - more resources
Full Text Sources
Other Literature Sources
Molecular Biology Databases
