. 2017 Feb 2:7:41841.
doi: 10.1038/srep41841.

P-Selectin preserves immune tolerance in mice and is reduced in human cutaneous lupus

Affiliations

P-Selectin preserves immune tolerance in mice and is reduced in human cutaneous lupus

Rafael González-Tajuelo et al. Sci Rep. .

Abstract

Mice deficient in P-Selectin presented altered immunity/tolerance balance. We have observed that the absence of P-Selectin promotes splenomegaly with reduced naïve T cell population, elevated activated/effector T cell subset, increased germinal center B and Tfh populations and high production of autoreactive antibodies. Moreover, 1.5-3-month-old P-selectin KO mice showed reduced IL-10-producing leukocytes in blood and a slightly reduced Treg population in the skin. With aging and, coinciding with disease severity, there is an increase in the IL17+ circulating and dermal T cell subpopulations and reduction of dermal Treg. As a consequence, P-Selectin deficient mice developed a progressive autoimmune syndrome showing skin alterations characteristic of lupus prone mice and elevated circulating autoantibodies, including anti-dsDNA. Similar to human SLE, disease pathogenesis was characterized by deposition of immune complexes in the dermoepidermal junction and renal glomeruli, and a complex pattern of autoantibodies. More important, skin biopsies of cutaneous lupus erythematosus patients did not show increased expression of P-Selectin, as described for other inflammatory diseases, and the number of vessels expressing P-Selectin was reduced.


Conflict of interest statement

The authors declare no competing financial interests.

Figures

Figure 1
Figure 1. Spontaneous generation of autoantibodies related to connective tissue autoimmune diseases in P-Sel−/− mice.
(a) Representative immunofluorescence photomicrographs of HEp-2 cells incubated with serum from 2 independent wild-type (WT) and 2 independent P-Sel−/− mice. (b) Percentage of mice positive for anti-Sm, RNP, Scl-70 and Jo-1 autoantibodies (n = 8–10 animals per group); *p < 0.05 by Chi-square test. (c) Percentage of mice positive for anti-dsDNA autoantibodies (n = 8–10 animals per group); *p < 0.05 by Chi-square test. Immunofluorescence photomicrographs of C. luciliae incubated with serum of a P-Sel−/− mouse (right panel). (d) Photograph of representative spleens of 3-month-old WT and P-Sel−/− mice (upper panel). Spleen weight/body weight ratio of female and male 3-month-old WT and P-Sel−/− mice (middle panel) (n = 6 mice per group). Total number of cells per spleen of WT and P-Sel−/− mice (lower panel). (e,f) Percentage of splenic follicular T helper (Tfh) cells (e) and germinal center (GC) B cells (f) in 3-month-old male WT and P-Sel−/− mice. *p < 0.05; ***p < 0.005 by Student’s two-tailed t-test. Bars show the mean ± standard deviation (SD).
Figure 2
Figure 2. Peripheral blood and spleen immune system characterization in P-Sel−/− mice.
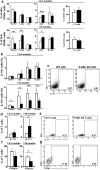
(a) Relative frequency of peripheral blood leukocyte populations of 1.5–3 month-old WT and P-Sel−/− mice. (b,d) Percentage of IL-10+ conventional dendritic cells (cDC), plasmacytoid DC (pDC), monocytes, granulocytes and B cells; and frequency of IL-10 and IL-17 producing CD4+ and CD8+ T lymphocytes, in 1.5-month-old (b) and >18-month-old (d) WT and P-Sel−/− mice. (c) Representative dot plots of IL-10+ cDCs and IL-10 and IL-17 producing CD4+ T cells in 1.5-months old WT and P-Sel−/− mice. (e) Phenotyping of CD4+ and CD8+ splenic T lymphocytes according to the expression of the naïve/memory/effector markers CD62L and CD44 in 1.5–3 months-old (upper panels) and >18 month-old (lower panels) WT and P-Sel−/− mice. (f) Representative dot plots showing the distribution of 1.5–3-month-old mice splenic populations according to the expression of L-Selectin and CD44. In all cases, n = 4 mice per group. In all cases, n = 4 mice per group. Bars represent the mean ± SD. *p < 0.05; **p < 0.01; ***p < 0.005, by Student’s two tailed t test.
Figure 3
Figure 3. Characterization of the skin immune system of P-Sel−/− mice.
(a) Relative frequency of skin leukocyte populations of 1.5–3 month-old and >18-month-old WT and P-Sel−/− mice. (b) Percentage of IL-10+ macrophages (CD11b+), conventional dendritic cells (cDC), plasmacytoid DC (pDC) and B cells, in 1.5–3-month-old and >18-month-old WT and P-Sel−/− mice. (c) Representative dot plots of IL-10+ cDCs in >18-month-old WT and P-Sel−/− mice. (d) Percentage of IL-17+ T cells in 1.5–3-month-old and >18-month-old WT and P-Sel−/− mice. (e) Representative dot plots of IL-17+ T cells in >18-month-old WT and P-Sel−/− mice. (f) Percentage of FOXP3+ T cells in 1.5–3-month-old and >18-month-old WT and P-Sel−/− mice. (g) Representative dot plots of FOXP3+ T cells in >18-month-old WT and P-Sel−/− mice. *p < 0.05; **p < 0.01 by Student’s two tailed t test. n = 6 mice per genotype.
Figure 4
Figure 4. Histological alterations in the skin of P-Sel−/− mice.
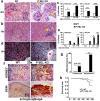
(a) Photomicrographs (10×) of hematoxylin and eosin (H&E)-stained skin sections of 1.5 month-old (upper panels) and 24-month-old female and male WT and P-Sel−/− mice (lower panels). Blue arrowheads show panniculitis. Black arrowheads show acanthosis; arrows show hyperkeratosis and keratin plugs. Scale bars represent 200 μm. (b) Quantification of dermis, epidermis and corneal layer width of WT and P-Sel−/− mice. (c) Pathological activity index of skin samples obtained from WT and P-Sel−/− mice. (d) Lesions developed in the back of UV-irradiated 3-month-old female WT and P-Sel−/− mice. (e) Photomicrographs (5×) of representative skin sections of UV-irradiated 3-month-old female WT and P-Sel−/− mice. n = 4 mice per genotype. Representative experiment of three independent replicates. Scale bars represent 500 μm. (f) Pathological activity index of skin samples obtained from UV-irradiated 3-month-old female WT and P-Sel−/− mice. (b,c,f) Bars show the mean ± SD *p < 0.05; **p < 0.01; ***p < 0.005 by Student’s two tailed t test. n = 8–10 mice per genotype.
Figure 5
Figure 5. Kidney alterations and deposits of immune complexes in skin and kidneys of P-Sel−/− mice.
(a) Representative photomicrographs (40×) of H&E-stained kidney glomeruli of WT and P-Sel−/− mice. Yellow arrow denotes a dilated Bowman’s space. Yellow arrowhead denotes a tubularized glomerulus. (b) Photomicrographs (10×) of kidney sections showing an immune infiltrate (yellow arrowhead) in P-Sel−/− mice. (c) Prevalence of immune infiltration in WT and P-Sel−/− mice (n = 8–10 mice per group). (d) Masson’s trichrome-stained kidney sections of WT and P-Sel−/− mice (10×), showing healthy and infarcted tissue (red arrowhead), respectively. (e) Prevalence of renal infarcts in WT and P-Sel−/− mice (n = 8–10 mice per group). (f) Representative photomicrographs of anti-IgM+ IgA+ IgG-stained kidney (upper panels) and skin (lower panels) sections (20×). n = 4–5 mice per group. Yellow arrow points to the dermoepidermal junction. (g) Frequency of proteinuria and hematuria in >12-month-old WT and P-Sel−/− mice (n = 14–16 mice per group). (h) Kaplan-Meier survival curves for WT and P-Sel−/− mice (n = 20 WT and 23 P-Sel−/− mice); p = 0.033 by Mantel-Cox test. (c,e,g) *p < 0.05; **p < 0.01; ***p < 0.005 by Chi-square test.
Figure 6
Figure 6. Decreased expression of P-Selectin in human SLE biopsies.
(a) Representative photomicrographs (20×) of anti-CD31 and anti-P-Selectin stained skin biopsies of healthy donors and SLE patients (upper panels). Black arrows point blood vessels. (b) 200% magnification of representative blood vessels from the original images are represented (lower panels). (c) Classification and quantification of CD31+ dermal blood vessels according to the expression level of P-Selectin (healthy controls, n = 4; SLE patients, n = 4); bars show the mean ± SD. **p < 0.01 by Student’s two tailed t test.

References

    1. Zarbock A., Ley K., McEver R. P. & Hidalgo A. Leukocyte ligands for endothelial selectins: specialized glycoconjugates that mediate rolling and signaling under flow. Blood 118, 6743–6751 (2011). - PMC - PubMed
    1. McEver R. P. & Zhu C. Rolling cell adhesion. Annu Rev Cell Dev Biol 26, 363–396 (2010). - PMC - PubMed
    1. Vestweber D. & Blanks J. Mechanisms that regulate the function of the selectins and their ligands. Physiol Rev 79, 181–213 (1999). - PubMed
    1. Wagner J. G. & Roth R. A. Neutrophil Migration Mechanisms, with an Emphasis on the Pulmonary Vasculature. Pharmacol Rev 52, 349–374 (2000). - PubMed
    1. Ley K. The role of selectins in inflammation and disease. Trends Mol Med 9, 263–268 (2003). - PubMed

Publication types

MeSH terms

LinkOut - more resources