

Expression and prognostic significance of zinc fingers and homeoboxes family members in renal cell carcinoma
- PMID: 28152006
- PMCID: PMC5289508
- DOI: 10.1371/journal.pone.0171036
Expression and prognostic significance of zinc fingers and homeoboxes family members in renal cell carcinoma
Abstract
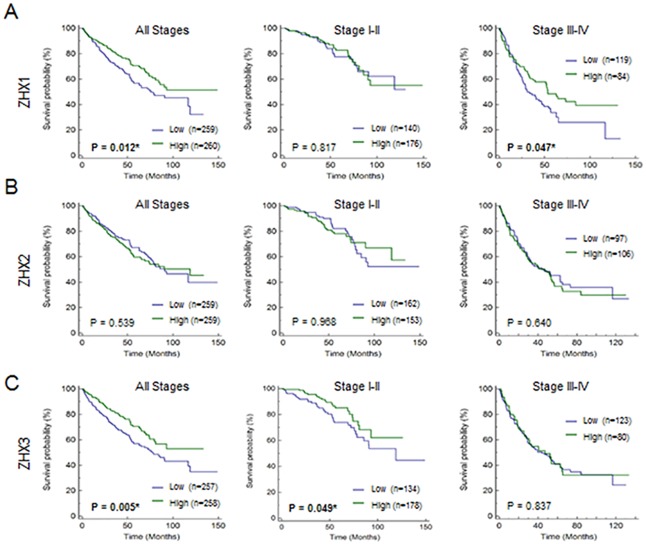
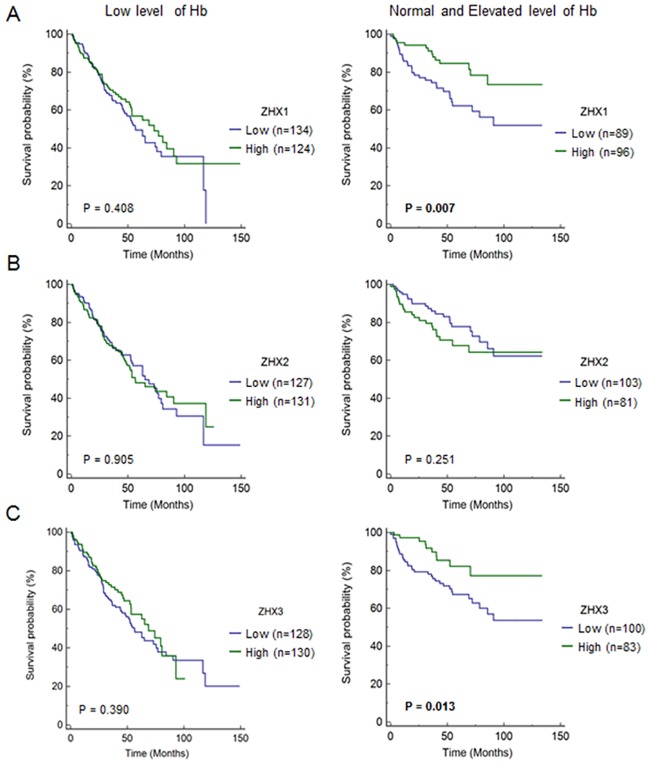
Zinc fingers and homeoboxes (ZHX) is a transcription repressor family that contains three members; ZHX1, ZHX2, and ZHX3. Although ZHX family members have been associated with the progression of cancer, their values as prognostic factors in cancer patients have been poorly examined. Renal cell carcinoma (RCC) is a highly heterogeneous, aggressive cancer that responds variably to treatment. Thus, prognostic molecular markers are required to evaluate disease progression and to improve the survival. In clear cell RCC (ccRCC), ZHX1 and ZHX3 expression were found to be down-regulated but ZHX2 was up-regulated, and the expressions of ZHX1 and ZHX3 were significantly associated with pathological stage. Furthermore, Kaplan-Meier and multivariate regression analysis showed that reduction in the mRNA expression of ZHX1 was associated with poorer survival. Taken together, the present study shows loss of ZHX1 is correlated with ccRCC progression and suggests it is an independent prognostic marker in ccRCC.
Conflict of interest statement
The authors have declared that no competing interests exist.
Figures

Similar articles
-
Zinc Fingers and Homeobox Family in Cancer: A Double-Edged Sword.Int J Mol Sci. 2022 Sep 22;23(19):11167. doi: 10.3390/ijms231911167. Int J Mol Sci. 2022. PMID: 36232466 Free PMC article. Review.
-
Analysis of zinc-fingers and homeoboxes (ZHX)-1-interacting proteins: molecular cloning and characterization of a member of the ZHX family, ZHX3.Biochem J. 2003 Jul 1;373(Pt 1):167-78. doi: 10.1042/BJ20021866. Biochem J. 2003. PMID: 12659632 Free PMC article.
-
The mouse zinc-fingers and homeoboxes (ZHX) family; ZHX2 forms a heterodimer with ZHX3.Gene. 2003 Dec 24;323:133-40. doi: 10.1016/j.gene.2003.09.013. Gene. 2003. PMID: 14659886
-
Zinc-fingers and homeoboxes (ZHX) 2, a novel member of the ZHX family, functions as a transcriptional repressor.Biochem J. 2003 Aug 1;373(Pt 3):747-57. doi: 10.1042/BJ20030171. Biochem J. 2003. PMID: 12741956 Free PMC article.
-
Zinc fingers and homeoboxes family in human diseases.Cancer Gene Ther. 2015 May;22(5):223-6. doi: 10.1038/cgt.2015.16. Epub 2015 Apr 10. Cancer Gene Ther. 2015. PMID: 25857360 Review.
Cited by
-
Transcriptional control of kidney cancer.Science. 2018 Jul 20;361(6399):226-227. doi: 10.1126/science.aau4385. Science. 2018. PMID: 30026212 Free PMC article. No abstract available.
-
HAGLR, A Long Non-coding RNA of Potential Tumor Suppressive Function in Clear Cell Renal Cell Carcinoma: Diagnostic and Prognostic Implications.Mol Biotechnol. 2024 Dec;66(12):3485-3497. doi: 10.1007/s12033-023-00948-z. Epub 2023 Nov 13. Mol Biotechnol. 2024. PMID: 37955777
-
The Role of Compounds Derived from Natural Supplement as Anticancer Agents in Renal Cell Carcinoma: A Review.Int J Mol Sci. 2017 Dec 31;19(1):107. doi: 10.3390/ijms19010107. Int J Mol Sci. 2017. PMID: 29301217 Free PMC article. Review.
-
Zinc Fingers and Homeobox Family in Cancer: A Double-Edged Sword.Int J Mol Sci. 2022 Sep 22;23(19):11167. doi: 10.3390/ijms231911167. Int J Mol Sci. 2022. PMID: 36232466 Free PMC article. Review.
-
VHL substrate transcription factor ZHX2 as an oncogenic driver in clear cell renal cell carcinoma.Science. 2018 Jul 20;361(6399):290-295. doi: 10.1126/science.aap8411. Science. 2018. PMID: 30026228 Free PMC article.
References
-
- Kucuk U, Pala EE, Sezer O, Cakir E, Bayol U, Divrik RT. Significance of TNM staging, Demographic and Histologic Features in Predicting the Prognosis of Renal Cell Carcinoma. Acta chirurgica Belgica. 2015;115(3):202–7. Epub 2015/07/15. - PubMed
-
- Vermassen T, De Meulenaere A, Van de Walle M, Rottey S. Therapeutic approaches in clear cell and non-clear cell renal cell carcinoma. Acta clinica Belgica. 2016:1–7. Epub 2016/06/30. - PubMed
MeSH terms
Substances
LinkOut - more resources
Full Text Sources
Other Literature Sources
Medical
Molecular Biology Databases
