. 2017 Feb 2;12(2):e0171503.
doi: 10.1371/journal.pone.0171503. eCollection 2017.

Nik-related kinase regulates trophoblast proliferation and placental development by modulating AKT phosphorylation

Affiliations

Nik-related kinase regulates trophoblast proliferation and placental development by modulating AKT phosphorylation

Yuka Morioka et al. PLoS One. .

Abstract

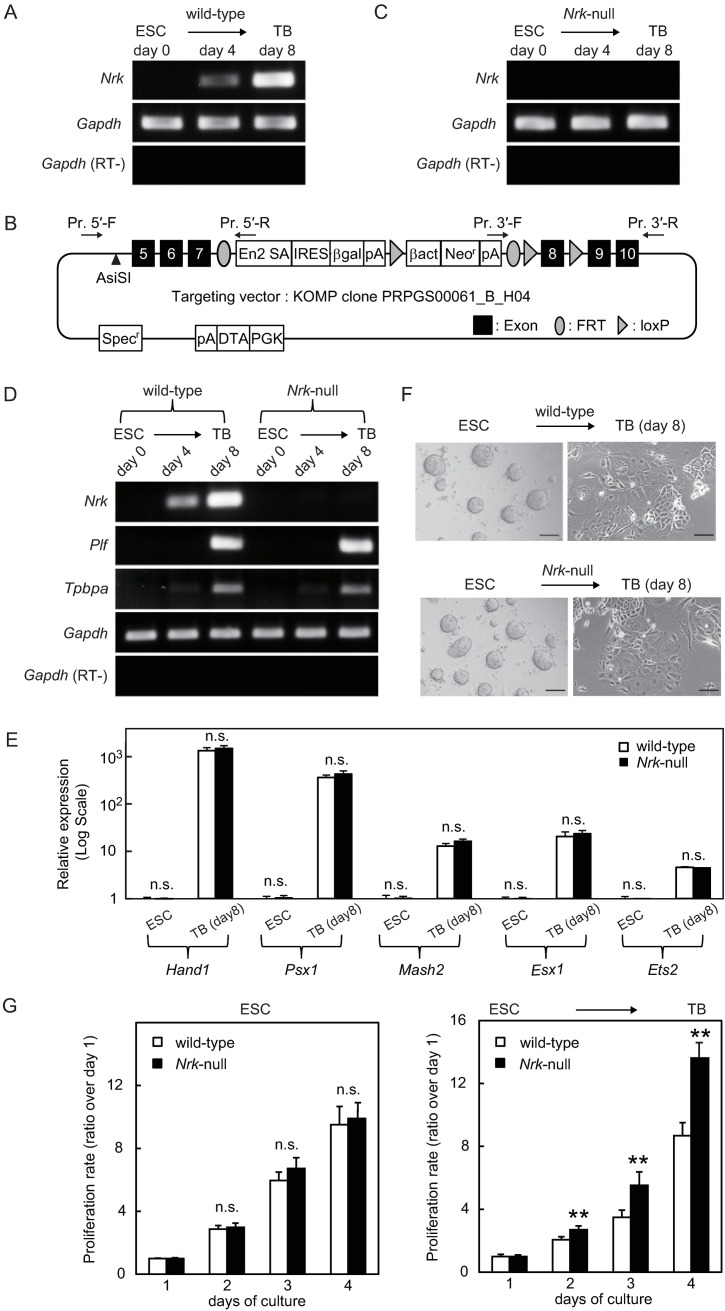
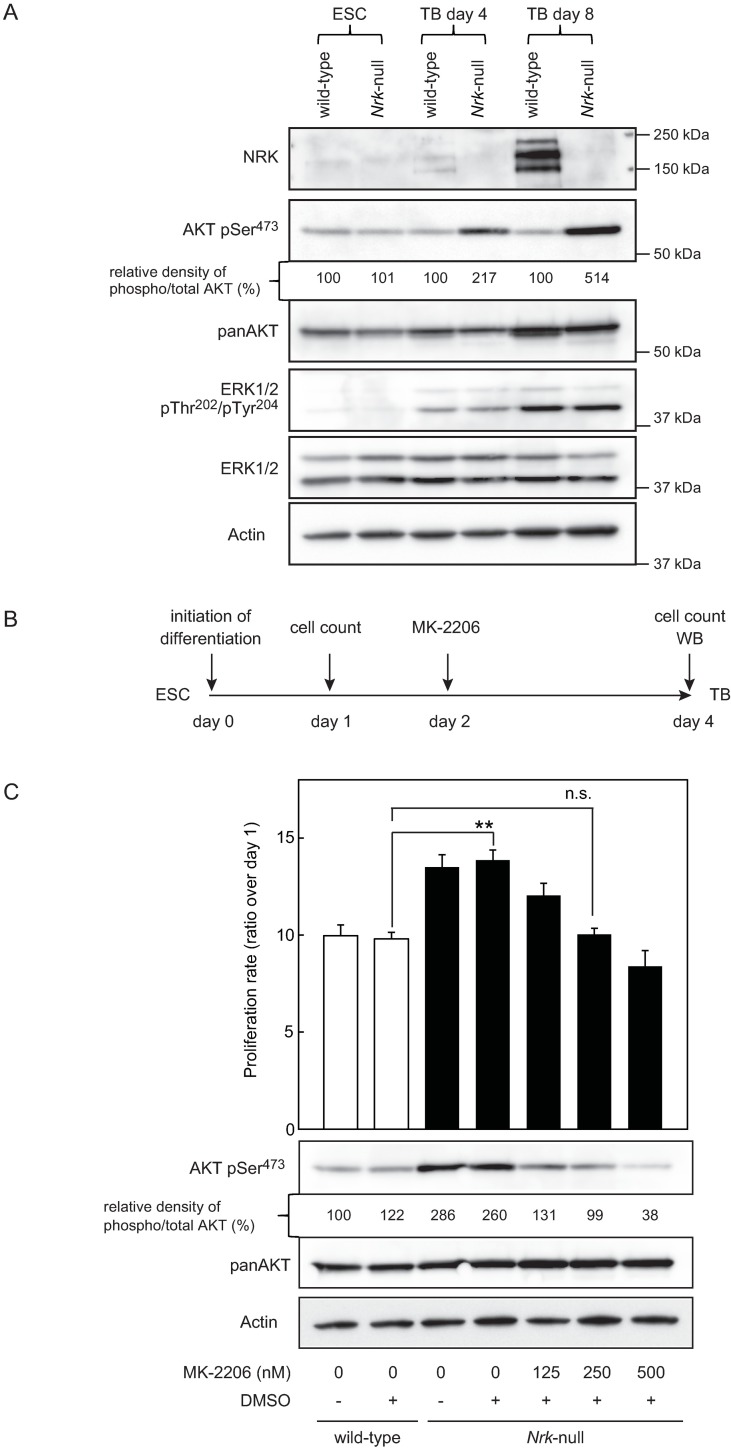
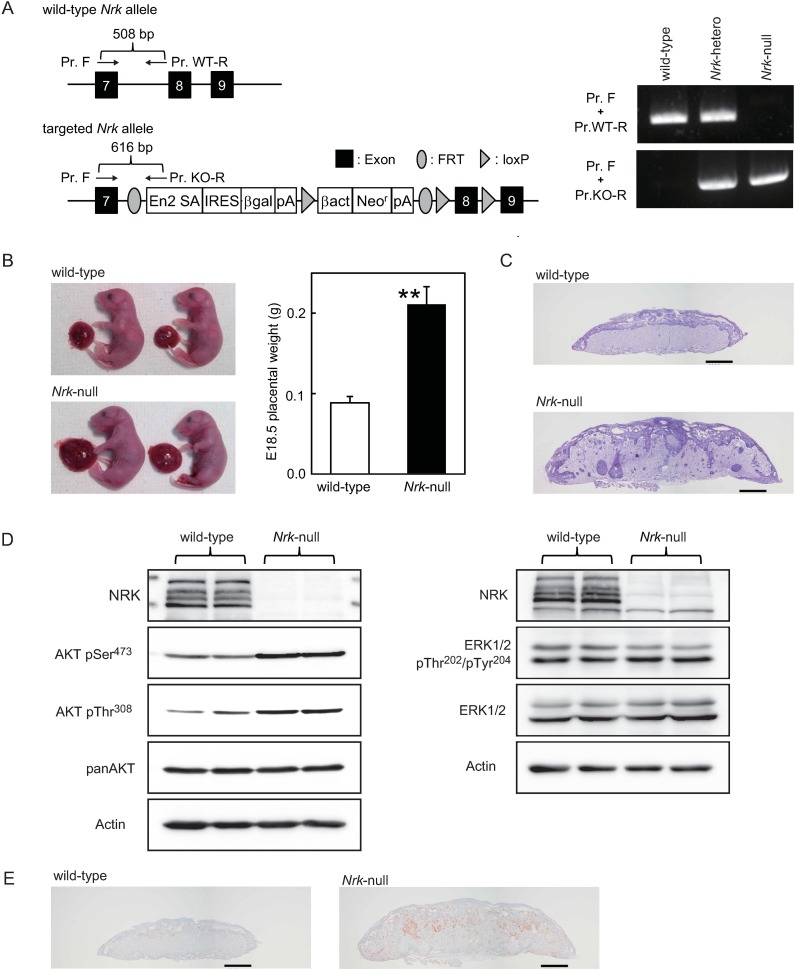
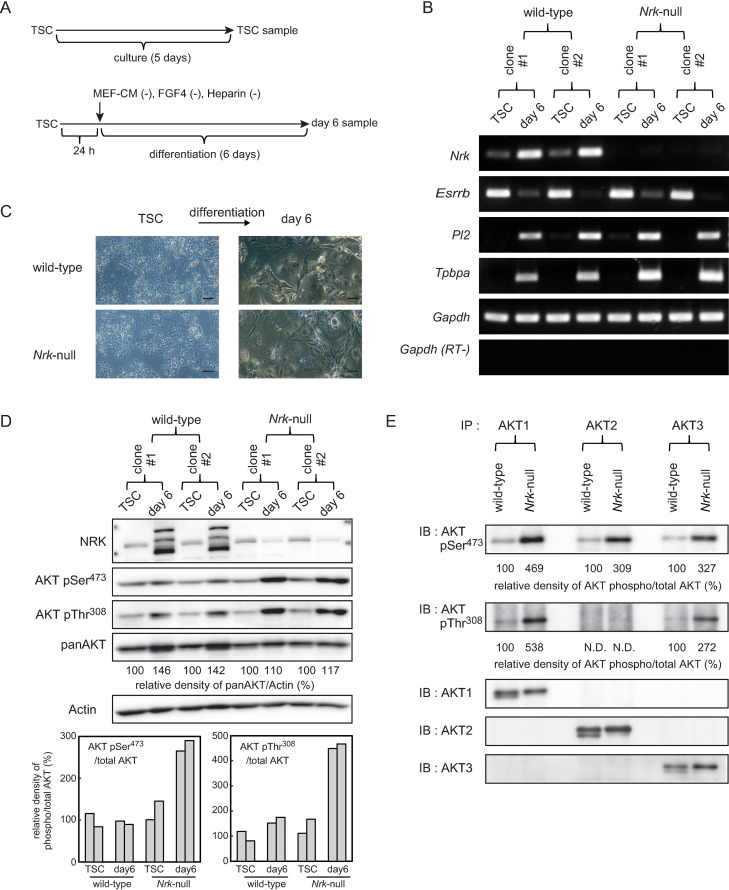
Nik-related kinase (Nrk) is a Ser/Thr kinase and was initially discovered as a molecule that was predominantly detected in skeletal muscles during development. A recent study using Nrk-null mice suggested the importance of Nrk in proper placental development; however, the molecular mechanism remains unknown. In this study, we demonstrated that differentiated trophoblasts from murine embryonic stem cells (ESCs) endogenously expressed Nrk and that Nrk disruption led to the enhanced proliferation of differentiated trophoblasts. This phenomenon may reflect the overproliferation of trophoblasts that has been reported in enlarged placentas of Nrk-null mice. Furthermore, we demonstrated that AKT phosphorylation at Ser473 was upregulated in Nrk-null trophoblasts and that inhibition of AKT phosphorylation cancelled the enhanced proliferation observed in differentiated Nrk-null trophoblasts. These results indicated that the upregulation of AKT phosphorylation was the possible cause of enhanced proliferation observed in Nrk-null trophoblasts. The upregulation of AKT phosphorylation was also confirmed in enlarged Nrk-null placentas in vivo, suggesting that proper regulation of AKT by Nrk was important for normal placental development. In addition, our detailed analysis on phosphorylation status of AKT isoforms in newly established trophoblast stem cells (TSCs) revealed that different levels of upregulation of AKT phosphorylation were occurred in Nrk-null TSCs depending on AKT isoforms. These results further support the importance of Nrk in proper development of trophoblast lineage cells and indicate the possible application of TSCs for the analysis of differently regulated activation mechanisms of AKT isoforms.


Conflict of interest statement

The authors have declared that no competing interests exist.

Figures

Fig 1
Fig 1. Disruption of Nrk resulted in enhanced proliferation of trophoblasts without obvious influence on their differentiation.
(A) Nrk expression in wild-type cells was examined using RT-PCR analysis. Total RNAs were isolated from undifferentiated ESCs (day 0) and differentiated trophoblasts (day 4 and day 8) and were subjected to RT-PCR amplification. As an internal control, Gapdh was also amplified. RT-PCR amplification of Gapdh was also performed in the absence of reverse transcriptase (RT-). (B) Construct of the gene-targeting vector for Nrk disruption. The endogenous Nrk expression was disturbed by a gene-trapping cassette inserted between exon 7 and 8 of Nrk gene. The arrowhead indicates AsiSI recognition site for linearization of the vector. The arrows indicate PCR primers for detection of the homologous recombination events. (C) Deficiency of Nrk expression in Nrk-null cells was confirmed using RT-PCR analysis. Total RNAs were isolated from Nrk-null cells and were subsequently subjected to RT-PCR amplification as described in (A). (D) RT-PCR analysis of trophoblast marker gene expressions in wild-type and Nrk-null cells. Total RNAs were isolated from undifferentiated ESCs (day 0) and differentiated trophoblasts (day 4 and day 8) and were subsequently subjected to RT-PCR amplification as described in (A). (E) Real-time PCR analysis of transcription factor expressions in wild-type and Nrk-null cells. Undifferentiated ESCs and differentiated trophoblasts (day 8) were analyzed (n = 3). The examined gene expressions were normalized to the amount of Gapdh control. Each gene expression in undifferentiated wild-type ESCs is indicated as 1. Data are presented as mean plus SD. n.s. = no significant difference. (F) Phase-contrast photomicrographs of undifferentiated ESCs (left) and differentiated trophoblasts at day 8 (right) with or without Nrk. Scale bars indicate 200 μm. (G) Proliferation of undifferentiated ESCs and differentiated ESCs into trophoblasts. Undifferentiated ESCs were seeded on a type I collagen-coated 24-well plate at 106 cells/well in a LIF-supplemented ESF7 medium (left) in which undifferentiated state of ESCs was maintained. Undifferentiated ESCs were seeded on a laminin-coated 24-well plate at 106 cells/well in an rhBMP4-supplemented ESF5 medium (right) in which ESCs were induced to differentiate into trophoblasts. The cells were counted every 24 h (n = 6). The value of day1 is indicated as 1. Data are presented as mean plus SD. **P<0.01 compared to wild-type. n.s. = no significant difference. Shown are cropped gels. The gels with indicated cropping lines are shown in S1 Fig. ESC: embryonic stem cell, TB: trophoblast.
Fig 2
Fig 2. Enhanced proliferation observed in differentiated Nrk-null trophoblasts was associated with the upregulation of AKT Ser473 phosphorylation.
(A) Western blot analysis of whole-cell extracts from ESCs and trophoblasts. Expressions of NRK, phosphorylated AKT at Ser473, total AKT, phosphorylated ERK1/2 at Thr202/Tyr204 and total ERK1/2 were compared between wild-type and Nrk-null cells. As an internal control, β-Actin was also detected. The relative density of phosphorylated vs total AKT was analyzed and was normalized to the value of wild-type. (B) The schematic representation of the experimental procedure to examine the effect of AKT inhibitor MK-2206. (C) Dose dependent effect of MK-2206 on the proliferation and AKT Ser473 phosphorylation in the differentiated Nrk-null trophoblasts. The proliferation rate of the trophoblasts on day 4 was calculated relative to the untreated day 1 control (n = 4) (top). Data are presented as mean plus SD. **P<0.01compared to wild-type. n.s. = no significant difference. Expression of phosphorylated AKT at Ser473 and total AKT in trophoblasts on day 4 was analyzed by western blotting (bottom). As an internal control, β-Actin was also detected. The relative density of phosphorylated vs total AKT was analyzed and was normalized to the value of untreated wild-type control. Shown are cropped blots. The blots with indicated cropping lines are shown in S3 Fig. WB: western blotting, ESC: embryonic stem cell, TB: trophoblast.
Fig 3
Fig 3. Upregulation of AKT phosphorylation in enlarged placentas derived from Nrk-null E18.5 mouse embryos.
(A) The wild-type Nrk allele and the targeted Nrk allele are shown (left). The arrows indicate PCR primers for detection of each allele. PCR genotyping of mice (right). (B) Wild-type and Nrk-null mouse placentas and foetuses at E18.5 are shown (left). The placental weight was measured at E18.5 in wild-type (n = 24) and Nrk-null (n = 25) embryos (right). Data are presented as mean plus SD. **P<0.01 compared to wild-type. (C) PAS staining of E18.5 placental sections. Scale bars indicate 1 mm. (D) The lysates were prepared from wild-type (n = 2) and Nrk-null (n = 2) placentas at E18.5 and were subjected to western blot analysis. Expressions of NRK, phosphorylated AKT at Ser473, phosphorylated AKT at Thr308 and total AKT were compared between wild-type and Nrk-null placentas (left). Expressions of NRK, phosphorylated ERK1/2 and total ERK1/2 were compared between wild-type and Nrk-null placentas (right). As an internal control, β-Actin was also detected. (E) Immunostaining of E18.5 placental sections with anti-AKT pSer473 antibodies. Scale bars indicate 1 mm. Shown are cropped gels/blots. The gels/blots with indicated cropping lines are shown in S4 Fig.
Fig 4
Fig 4. Phosphorylation of all AKT isoforms were upregulated in differentiated Nrk-null trophoblast stem cells.
(A) The schematic representation of cell culture conditions. (B) RT-PCR analysis of undifferentiated and differentiated TSC marker gene expressions in wild-type and Nrk-null cells. Total RNAs were isolated from undifferentiated (TSC) and differentiated (day 6) cells and were subjected to RT-PCR amplification. As an internal control, Gapdh was also amplified. RT-PCR amplification of Gapdh was also performed in the absence of reverse transcriptase (RT-). (C) Phase-contrast photomicrographs of undifferentiated TSCs (left) and differentiated TSCs at day 6 (right) with or without Nrk. Scale bars indicate 200 μm. (D) Western blot analysis of whole-cell extracts from undifferentiated (TSC) and differentiated (day 6) cells. Expressions of NRK, phosphorylated AKT at Ser473, phosphorylated AKT at Thr308 and total AKT were compared between wild-type and Nrk-null cells. As an internal control, β-Actin was also detected (top). The relative density of total AKT vs β-Actin was analyzed and was indicated in the blot (top). The value of day 6 was normalized to the value of TSC of each clone. The relative density of phosphorylated vs total AKT was analyzed and was indicated in the graphs (bottom). The relative density was calculated by dividing the percent value for each sample by the mean percent value for wild-type TS cells, which represents 100%. (E) Immunoprecipitation was performed using anti-AKT1, anti-AKT2 and anti-AKT3 antibodies in whole-cell extracts from differentiated (day 6) TSCs. Following immunoprecipitation, immunoblot was performed using anti-AKTpSer473, anti-AKTpThr308, anti-AKT1, anti-AKT2 and anti-AKT3 antibodies. The relative density of phosphorylated vs total AKT was analyzed and was normalized to the value of wild-type. Shown are cropped gels/blots. The gels/blots with indicated cropping lines are shown in S5 and S6 Figs. TSC: trophoblast stem cell, IP: immunoprecipitation, IB: immunoblot, N.D.: not detectable.

Similar articles

Cited by

References

    1. Cross JC. How to make a placenta: mechanisms of trophoblast cell differentiation in mice—a review. Placenta. 2005; 26 Suppl A: S3–9. - PubMed
    1. Fisher SJ. Why is placentation abnormal in preeclampsia? Am J Obstet Gynecol. 2015; 213 (4 Suppl): S115–122. 10.1016/j.ajog.2015.08.042 - DOI - PMC - PubMed
    1. Rossant J, Cross JC. Placental development: lessons from mouse mutants. Nat Rev Genet. 2001; 2: 538–548. 10.1038/35080570 - DOI - PubMed
    1. Frank D, Fortino W, Clark L, Musalo R, Wang W, Saxena A, et al. Placental overgrowth in mice lacking the imprinted gene Ipl. Proc Natl Acad Sci USA. 2002; 99: 7490–7495. 10.1073/pnas.122039999 - DOI - PMC - PubMed
    1. Tunster SJ, Van de Pette M, John RM. Fetal overgrowth in the Cdkn1c mouse model of Beckwith-Wiedemann syndrome. Dis Model Mech. 2011; 4: 814–821. 10.1242/dmm.007328 - DOI - PMC - PubMed

MeSH terms

Substances