

Morbid obesity in Taiwan: Prevalence, trends, associated social demographics, and lifestyle factors
- PMID: 28152059
- PMCID: PMC5289420
- DOI: 10.1371/journal.pone.0169577
Morbid obesity in Taiwan: Prevalence, trends, associated social demographics, and lifestyle factors
Abstract
Objective: Obesity is one of the most important public health issues worldwide. Moreover, an extreme phenotype, morbid obesity (MO) has insidiously become a global problem. Therefore, we aimed to document the prevalence trend and to unveil the epidemiological characteristics of MO in Taiwan.
Methods: Nationally representative samples aged 19 years and above from three consecutive waves of Nutrition and Health survey in Taiwan: 1993-1996, 2005-2008, and 2013-2014 (n = 3,071; 1,673; and 1,440; respectively) were analyzed for prevalence trend. And 39 MO (BMI ≥35 kg/m2) cases from the two recent surveys compared with 156 age, gender, and survey-matched normal weight controls (BMI: 18.5-24 kg/m2) for epidemiological characteristics study. The reduced rank regression analysis was used to find dietary pattern associated with MO.
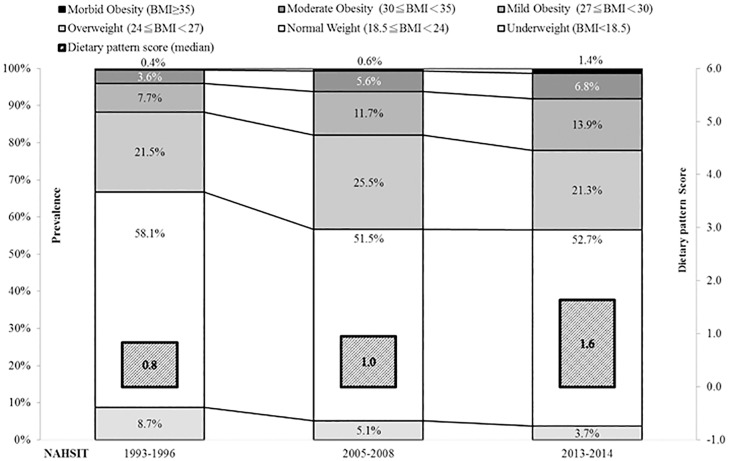
Results: The prevalence of overweight and obesity together (BMI ≥24 kg/m2) was stabilized in the recent two surveys, but that of MO (0.4%, 0.6%, to 1.4%) and obesity (BMI ≥27 kg/m2) (11.8%, 17.9%, to 22.0%) increased sharply. MO cases tended to have lower levels of education, personal income, and physical activity. Furthermore, their dietary pattern featured with a higher consumption frequency of red meat, processed animal products, and sweets/sweetened beverage, but lower frequencies of fresh fruits, nuts, breakfast cereal, and dairy products.
Conclusion: This study documents a polarization phenomenon with smaller proportion of overweight people at the center and higher proportions of normal weight and obesity subjects at two extremes. MO was associated with low socioeconomic status and poor dietary pattern. The obesogenic dietary pattern became more prevalent in later time.
Conflict of interest statement
The authors have declared that no competing interests exist.
Figures
Similar articles
-
Beverage intake among preschool children and its effect on weight status.Pediatrics. 2006 Oct;118(4):e1010-8. doi: 10.1542/peds.2005-2348. Pediatrics. 2006. PMID: 17015497
-
Diet and health trends in Taiwan: comparison of two nutrition and health surveys from 1993-1996 and 2005-2008.Asia Pac J Clin Nutr. 2011;20(2):238-50. Asia Pac J Clin Nutr. 2011. PMID: 21669593
-
Lifestyle factors associated with obesity in a cohort of males in the central province of Sri Lanka: a cross-sectional descriptive study.BMC Public Health. 2017 Jan 5;17(1):27. doi: 10.1186/s12889-016-3963-3. BMC Public Health. 2017. PMID: 28056898 Free PMC article.
-
Obesity pandemic, correlated factors and guidelines to define, screen and manage obesity in Taiwan.Obes Rev. 2008 Mar;9 Suppl 1:22-31. doi: 10.1111/j.1467-789X.2007.00434.x. Obes Rev. 2008. PMID: 18307695 Review.
-
[Simple obesity in children. A study on the role of nutritional factors].Med Wieku Rozwoj. 2006 Jan-Mar;10(1):3-191. Med Wieku Rozwoj. 2006. PMID: 16733288 Review. Polish.
Cited by
-
Obstructive sleep apnea in young Asian adults with sleep-related complaints.Sci Rep. 2022 Nov 29;12(1):20582. doi: 10.1038/s41598-022-25183-5. Sci Rep. 2022. PMID: 36447027 Free PMC article.
-
Dysregulated Iron Metabolism-Associated Dietary Pattern Predicts an Altered Body Composition and Metabolic Syndrome.Nutrients. 2019 Nov 11;11(11):2733. doi: 10.3390/nu11112733. Nutrients. 2019. PMID: 31717994 Free PMC article.
-
InVestiGation of the Association of Physical Activity and Sedentary Behavior with tHe Occurrence of Future Cardiovascular Disease and Long Term Outcome in General Population Using the HEALTHCARE Database (VGH-HEALTHCARE).Acta Cardiol Sin. 2019 Sep;35(5):534-541. doi: 10.6515/ACS.201909_35(5).20190126A. Acta Cardiol Sin. 2019. PMID: 31571803 Free PMC article.
-
The Impact of a Lockdown for the COVID-19 Pandemic on Seasonal HbA1c Variation in Patients with Type 2 Diabetes.Life (Basel). 2023 Mar 11;13(3):763. doi: 10.3390/life13030763. Life (Basel). 2023. PMID: 36983918 Free PMC article.
-
Association between obesity and education level among the elderly in Taipei, Taiwan between 2013 and 2015: a cross-sectional study.Sci Rep. 2020 Nov 20;10(1):20285. doi: 10.1038/s41598-020-77306-5. Sci Rep. 2020. PMID: 33219305 Free PMC article.
References
-
- (WHO) WHO. Facts Sheet N°311, Obesity and overweight.: World Health Organization (WHO); 2015 [cited 2016 March]. http://www.who.int/mediacentre/factsheets/fs311/en/.
-
- Haslam DW, James WP. Obesity. Lancet. 2005;366(9492):1197–209. Epub 2005/10/04. - PubMed
-
- Visscher TL, Seidell JC. The public health impact of obesity. Annu Rev Public Health. 2001;22:355–75. Epub 2001/03/29. - PubMed
-
- Rokholm B, Baker JL, Sorensen TI. The levelling off of the obesity epidemic since the year 1999—a review of evidence and perspectives. Obesity reviews: an official journal of the International Association for the Study of Obesity. 2010;11(12):835–46. Epub 2010/10/27. - PubMed
MeSH terms
LinkOut - more resources
Full Text Sources
Other Literature Sources
