Do picture-based charts overestimate visual acuity? Comparison of Kay Pictures, Lea Symbols, HOTV and Keeler logMAR charts with Sloan letters in adults and children
- PMID: 28152076
- PMCID: PMC5289485
- DOI: 10.1371/journal.pone.0170839
Do picture-based charts overestimate visual acuity? Comparison of Kay Pictures, Lea Symbols, HOTV and Keeler logMAR charts with Sloan letters in adults and children
Abstract
Purpose: Children may be tested with a variety of visual acuity (VA) charts during their ophthalmic care and differences between charts can complicate the interpretation of VA measurements. This study compared VA measurements across four pediatric charts with Sloan letters and identified chart design features that contributed to inter-chart differences in VA.
Methods: VA was determined for right eyes of 25 adults and 17 children (4-9 years of age) using Crowded Kay Pictures, Crowded linear Lea Symbols, Crowded Keeler logMAR, Crowded HOTV and Early Treatment of Diabetic Retinopathy Study (ETDRS) charts in focused and defocused (+1.00 DS optical blur) conditions. In a separate group of 25 adults, we compared the VA from individual Kay Picture optotypes with uncrowded Landolt C VA measurements.
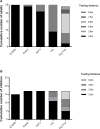
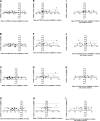
Results: Crowded Kay Pictures generated significantly better VA measurements than all other charts in both adults and children (p < 0.001; 0.15 to 0.30 logMAR). No significant differences were found between other charts in adult participants; children achieved significantly poorer VA measurements on the ETDRS chart compared with pediatric acuity tests. All Kay Pictures optotypes produced better VA (p < 0.001), varying from -0.38 ± 0.13 logMAR (apple) to -0.57 ± 0.10 logMAR (duck), than the reference Landolt C task (mean VA -0.19 ± 0.08 logMAR).
Conclusion: Kay Pictures over-estimated VA in all participants. Variability between Kay Pictures optotypes suggests that shape cues aid in optotype determination. Other pediatric charts offer more comparable VA measures and should be used for children likely to progress to letter charts.
Conflict of interest statement
The authors have declared that no competing interests exist.
Figures


References
-
- Holmes JM, Beck RW, Repka MX, Leske DA, Kraker RT, Blair RC, et al. The amblyopia treatment study visual acuity testing protocol. Arch Ophthalmol. 2001;119(9):1345–53. Epub 2001/09/27. - PubMed
-
- Group ViPS. Preschool visual acuity screening with HOTV and Lea symbols: testability and between-test agreement. Optometry & Vision Science. 2004;81(9):678–83. - PubMed
-
- Moke PS, Turpin AH, Beck RW, Holmes JM, Repka MX, Birch EE, et al. Computerized method of visual acuity testing: adaptation of the amblyopia treatment study visual acuity testing protocol. Am J Ophthalmol. 2001;132(6):903–9. Epub 2001/12/04. - PubMed
Publication types
MeSH terms
LinkOut - more resources
Full Text Sources
Other Literature Sources

