. 2017 Feb 2;12(2):e0170812.
doi: 10.1371/journal.pone.0170812. eCollection 2017.

NOX1 and NOX4 are required for the differentiation of mouse F9 cells into extraembryonic endoderm

Affiliations

NOX1 and NOX4 are required for the differentiation of mouse F9 cells into extraembryonic endoderm

Benjamin J Dickson et al. PLoS One. .

Abstract

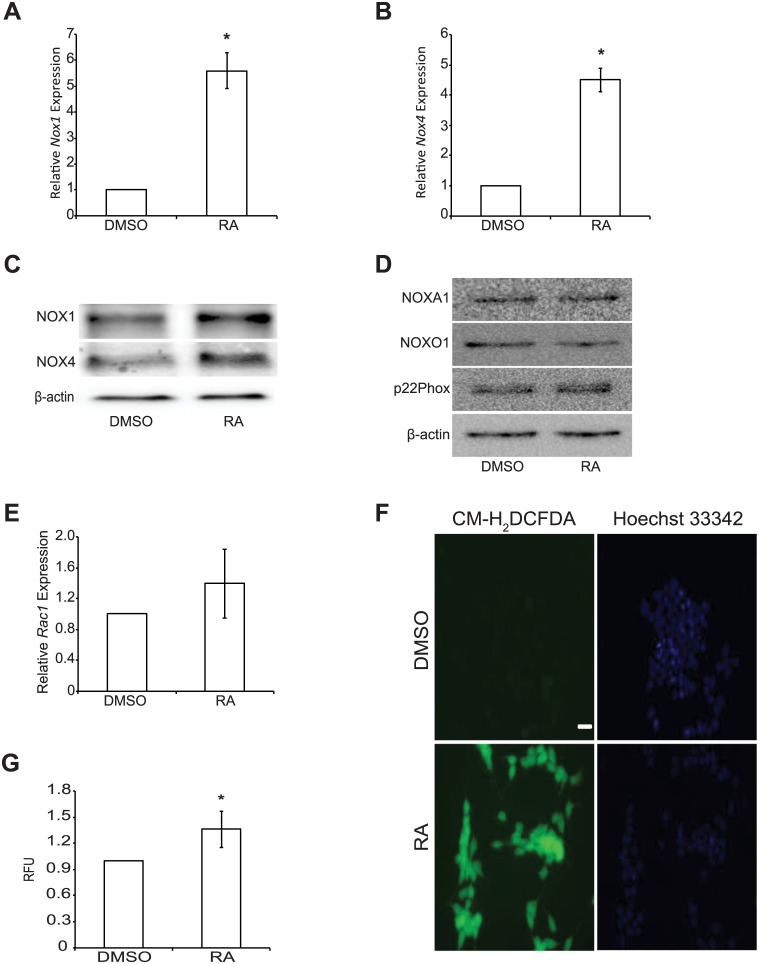
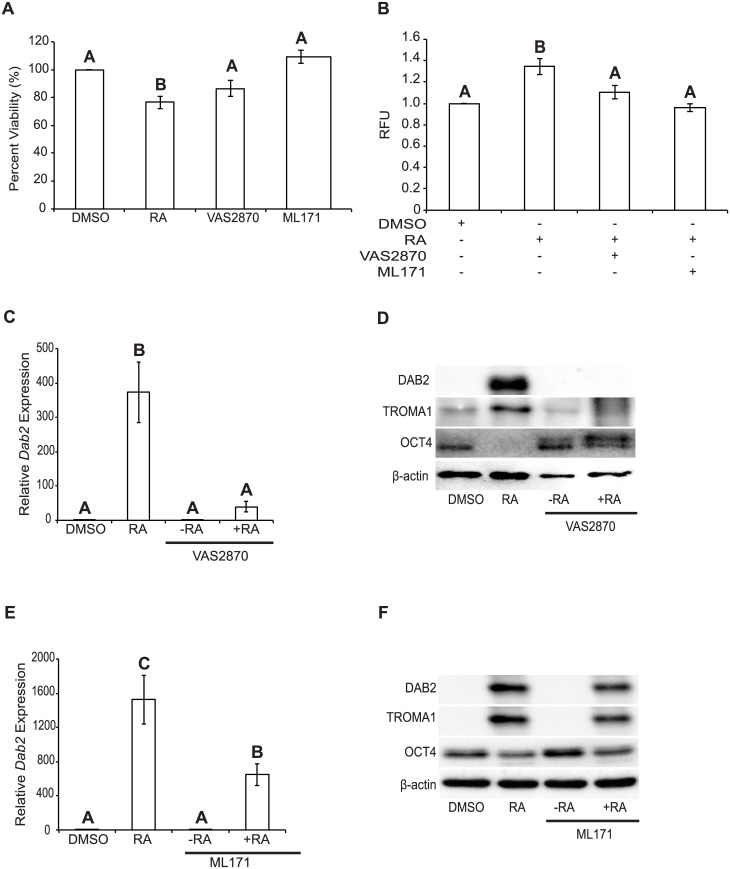
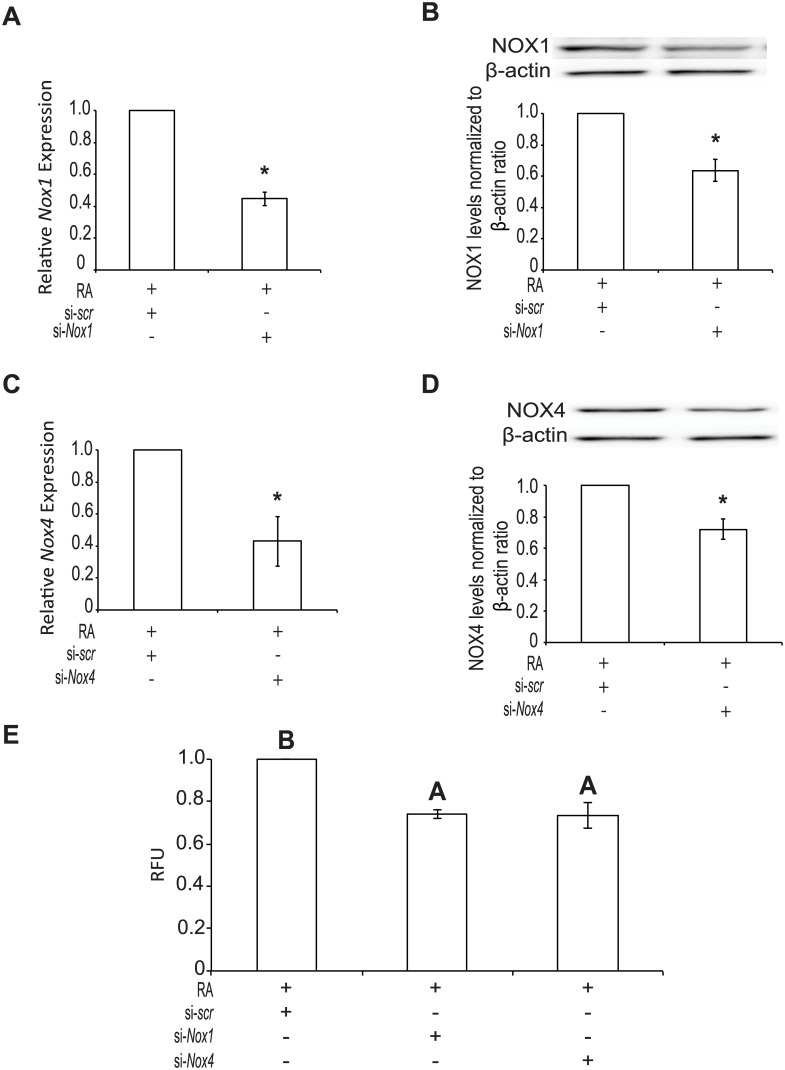
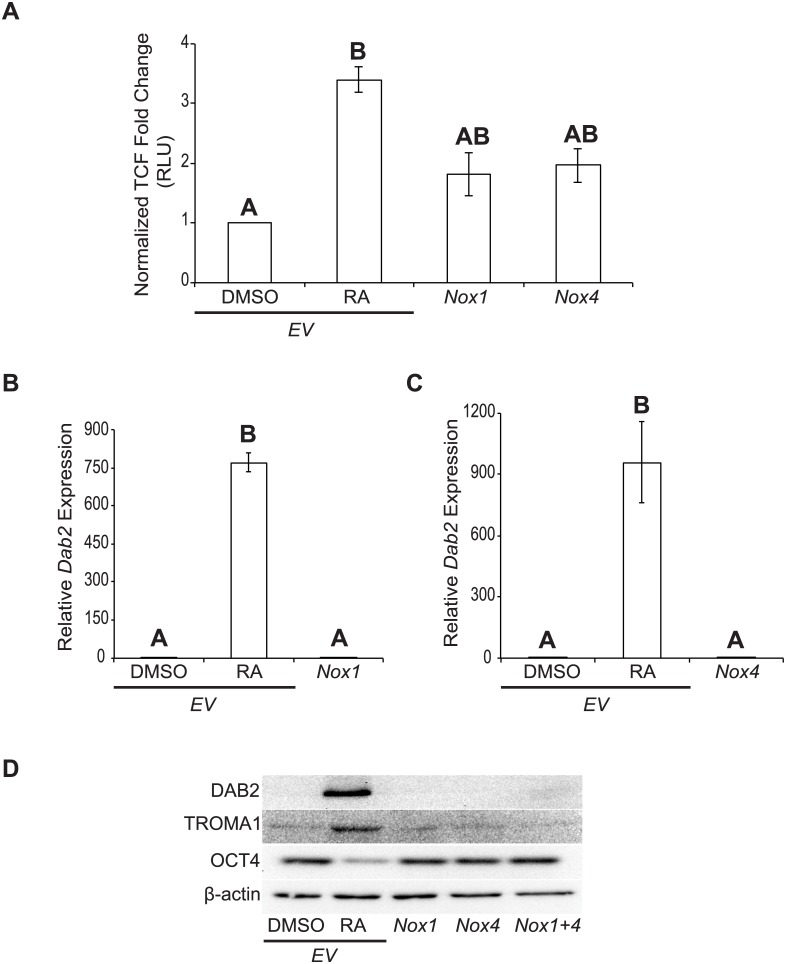
Mouse F9 cells differentiate to primitive endoderm (PrE) when treated with retinoic acid (RA). Differentiation is accompanied by increased reactive oxygen species (ROS) levels, and while treating F9 cells with antioxidants attenuates differentiation, H2O2 treatment alone is sufficient to induce PrE. We identified the NADPH oxidase (NOX) complexes as candidates for the source of this endogenous ROS, and within this gene family, and over the course of differentiation, Nox1 and Nox 4 show the greatest upregulation induced by RA. Gata6, encoding a master regulator of extraembryonic endoderm is also up-regulated by RA and we provide evidence that NOX1 and NOX4 protein levels increase in F9 cells overexpressing Gata6. Pan-NOX and NOX1-specific inhibitors significantly reduced the ability of RA to induce PrE, and this was recapitulated using a genetic approach to knockdown Nox1 and/or Nox4 transcripts. Interestingly, overexpressing either gene in untreated F9 cells did not induce differentiation, even though each elevated ROS levels. Thus, the data suggests that ROS produced during PrE differentiation is dependent in part on increased NOX1 and NOX4 levels, which is under the control of GATA6. Furthermore, these results suggest that the combined activity of multiple NOX proteins is necessary for the differentiation of F9 cells to primitive endoderm.


Conflict of interest statement

The authors have declared that no competing interests exist.

Figures

Fig 1
Fig 1. RA increases NOX1 and NOX4 levels and ROS production.
Total RNA and protein was harvested from F9 cells treated with either DMSO or RA for 4 days. (A) Nox1 and (B) Nox4 expression following DMSO or RA treatment. (C) NOX1 and NOX4 protein levels following DMSO and RA treatment. (D) Protein levels of NADPH oxidase complex accessory subunits NOXA1, NOXO1, and p22Phox following DMSO and RA treatment. (E) Rac1 expression following DMSO or RA treatment. (F) ROS detection using CM-H2DCFDA or (G) Amplex Red in F9 cells treated with either DMSO or RA. A total of 3–5 independent experiments were analyzed and results presented as mean ± SEM. * denotes significance (P < 0.05) tested by a Student’s t-Test.
Fig 2
Fig 2. Gata6 induction results in increased NOX1 and NOX4 levels.
Total RNA and protein was collected from F9 cells treated with DMSO or RA, or transfected with pcDNA3.1-EV (EV) and treated with either DMSO or RA, or transfected with pcDNA3.1-Gata6 (Gata6) and cultured 4 days. (A) Gata6 expression of F9 cells treated with DMSO or RA. (B) Gata6 expression of F9 cells transfected with EV or Gata6. (C) Immunoblot analysis for DAB2 (arrow), TROMA1 and OCT4 in F9 cells transfected with EV and treated with DMSO or RA or F9 cells ectopically expressing Gata6. (D) Nox1 and (E) Nox4 expression in F9 cells transfected with EV and treated with DMSO or RA, or F9 cells ectopically expressing Gata6. (F) Immunoblot analysis for NOX1 and NOX4 in F9 cells transfected with EV and treated with DMSO or RA, or F9 cells ectopically expressing Gata6. A total of 3 independent experiments were analyzed and results are presented as mean ± SEM. * denotes significance (P < 0.05) tested by a Student’s t-Test, whereas letters denote groups of significance (P < 0.05) tested by a One-Way ANOVA followed by a Tukey’s test.
Fig 3
Fig 3. Chemical inhibition of NOX proteins attenuates RA-mediated differentiation of F9 cells.
(A) MTT cell viability assay of F9 cells treated with DMSO, RA, VAS2870 or ML171. (B) F9 cells were treated with DMSO, RA, VAS2870 and RA, or ML171 and RA and assayed for ROS production using Amplex Red. (C) Dab2 expression of F9 cells treated with DMSO, RA, VAS2870, or VAS2870 and RA. (D) Immunoblot analysis for DAB2, TROMA1, and OCT4 in F9 cells treated with DMSO, RA, VAS2870, or VAS2870 and RA. (E) Dab2 expression of F9 cells treated with DMSO, RA, ML171, or ML171 and RA. (F) Immunoblot analysis for DAB2, TROMA,1 and OCT4 in F9 cells treated with DMSO, RA, ML171, or ML171 and RA. β-actin was used as a loading control. A total of 4 independent experiments were analyzed and results are presented as mean ± SEM. Letters denote groups of significance (P < 0.05) tested by a One-Way ANOVA followed by a Tukey’s test.
Fig 4
Fig 4. Nox1 and Nox4 knockdown reduces ROS production.
Total RNA was collected from F9 cells transfected with scrambled (scr) si-RNA, si-Nox1 and/or si-Nox4 siRNA and cultured 4 days with RA treatment. (A) Expression of Nox1 and (B) NOX1 protein levels following transfection with scr or si-Nox1 and RA treatment. (C) Expression of Nox4 and (D) NOX4 protein levels following transfection with scr or si-Nox1 and RA treatment. (E) ROS production detected using Amplex Red of F9 cells transfected with scr, si-Nox1, or si-Nox4 and treated with RA. A total of 3 independent experiments were analyzed and results are presented as mean ± SEM. * denotes significance (P < 0.05) tested by a Student’s t-Test, whereas letters denote groups of significance (P < 0.05) tested by a One-Way ANOVA followed by a Tukey’s test.
Fig 5
Fig 5. Nox1 and Nox4 knockdown attenuates RA-induced differentiation.
RNA was collected from F9 cells transfected with scrambled (scr) si-RNA, si-Nox1 and/or si-Nox4 siRNA and cultured 4 days with RA treatment. (A) Dab2 expression of F9 cells transfected with scr, si-Nox1, or si-Nox4 and treated with RA. (B) Immunoblot analysis for DAB2, TROMA1, and OCT4 in F9 cells transfected with scr, si-Nox1, or si-Nox4 and treated with RA. (C) Densitometric analysis for DAB2, TROMA1, and (D) OCT4 in F9 cells transfected with scr, si-Nox1, or si-Nox4 and treated with RA. β-actin was used as a loading control. A total of 3 independent experiments were analyzed and results are presented as mean ± SEM. Letters and symbols denote groups of significance (P < 0.05) tested by a One-Way ANOVA followed by a Tukey’s test.
Fig 6
Fig 6. Overexpressing Nox1 and Nox4 increases ROS production.
Total RNA was collected from F9 cells transfected with an empty vector (EV) control, pcDNA3.1-Nox1 or pcDNA3.1-Nox4 and cultured 4 days. (A) Nox1 and (B) Nox4 expression following transfection of pcDNA3.1-Nox1 or pcDNA3.1-Nox4, respectively, and relative to EV transfected cells. (C) NOX1 and (D) NOX4 protein levels following transfection of pcDNA3.1-Nox1 or pcDNA3.1-Nox4, respectively, relative to EV transfected cells. (E) ROS production using Amplex Red in F9 cells transfected with EV and treated with DMSO or RA, or transfected with pcDNA3.1-Nox1 or pcDNA3.1-Nox4. A total of 3 independent experiments were analyzed and results are presented as mean ± SEM. * denotes significance (P < 0.05) tested by a Student’s t-Test, whereas letters denote groups of significance (P < 0.05) tested by a One-Way ANOVA followed by a Tukey’s test.
Fig 7
Fig 7. Nox overexpression activates canonical Wnt signaling, but does not promote differentiation.
(A) Dual-luciferase assay of TCF activity in F9 cells transfected with EV and treated with DMSO or RA, or transfected with pcDNA3.1-Nox1 or pcDNA3.1-Nox4. (B) Dab2 expression in F9 cells transfected with EV and treated with DMSO or RA, or transfected with pcDNA3.1-Nox1. (C) Dab2 expression in F9 cells transfected with EV and treated with DMSO or RA, or transfected with pcDNA3.1-Nox4. (D) Immunoblot analysis for DAB2, TROMA1, and OCT4 in F9 cells transfected with EV and treated with DMSO or RA, or transfected with pcDNA3.1-Nox1, pcDNA3.1-Nox4 or both vectors. β-actin was used as a loading control. A total of 3 independent experiments were analyzed and results are presented as mean ± SEM. Letters denote groups of significance (P < 0.05) tested by a One-Way ANOVA followed by a Tukey’s test.

Similar articles

Cited by

References

    1. Krawetz R, Kelly GM. Wnt6 induces the specification and epithelialization of F9 embryonal carcinoma cells to primitive endoderm. Cell Signal. 2008;20(3):506–17. 10.1016/j.cellsig.2007.11.001 - DOI - PubMed
    1. Strickland S, Smith KK, Marotti KR. Hormonal induction of differentiation in teratocarcinoma stem cells: generation of parietal endoderm by retinoic acid and dibutyryl cAMP. Cell. 1980;21(2):347–55. - PubMed
    1. Wen JW, Hwang JT, Kelly GM. Reactive oxygen species and Wnt signalling crosstalk patterns mouse extraembryonic endoderm. Cell Signal. 2012;24(12):2337–48. 10.1016/j.cellsig.2012.07.024 - DOI - PubMed
    1. Sandieson L, Hwang JT, Kelly GM. Redox regulation of canonical Wnt signaling affects extraembryonic endoderm formation. Stem Cells Dev. 2014;23(10):1037–49. 10.1089/scd.2014.0010 - DOI - PubMed
    1. Funato Y, Miki H. Redox regulation of Wnt signalling via nucleoredoxin. Free Radic Res. 2010;44(4):379–88. 10.3109/10715761003610745 - DOI - PubMed

MeSH terms