. 2017 Jul;46(1):102-114.
doi: 10.1002/jmri.25595. Epub 2017 Feb 2.

Accelerated dual-venc 4D flow MRI for neurovascular applications

Affiliations

Accelerated dual-venc 4D flow MRI for neurovascular applications

Susanne Schnell et al. J Magn Reson Imaging. 2017 Jul.

Abstract

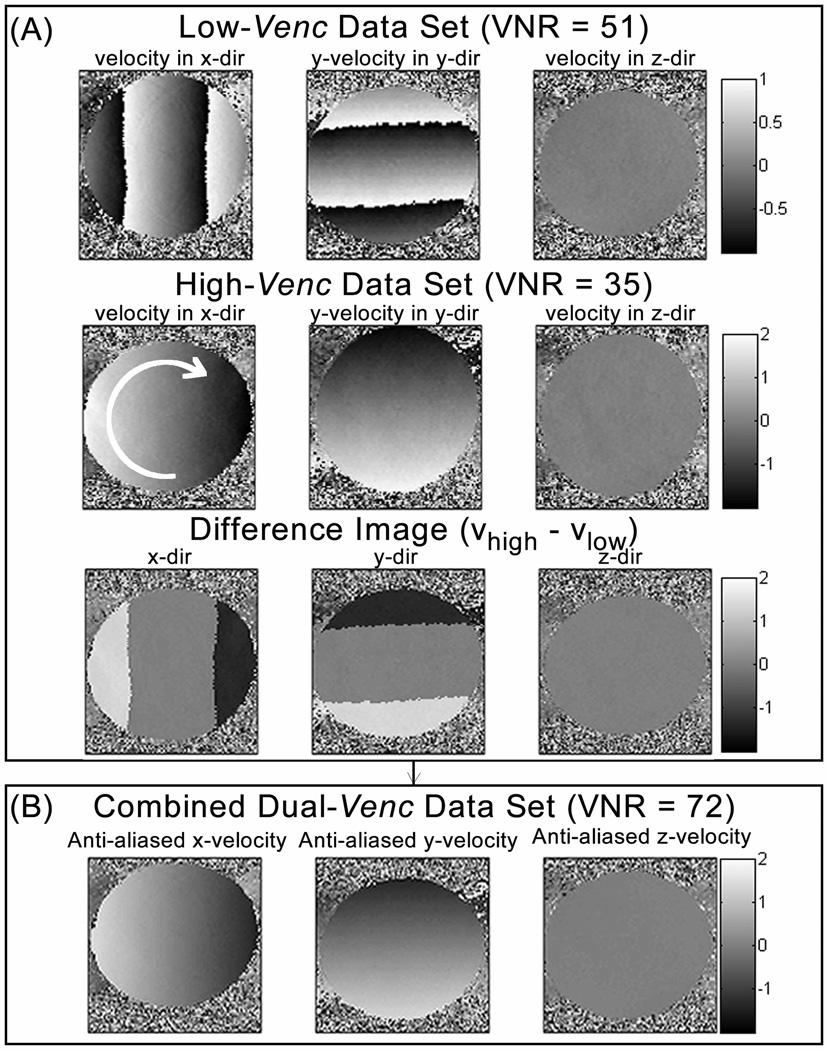
Purpose: To improve velocity-to-noise ratio (VNR) and dynamic velocity range of 4D flow magnetic resonance imaging (MRI) by using dual-velocity encoding (dual-venc) with k-t generalized autocalibrating partially parallel acquisition (GRAPPA) acceleration.

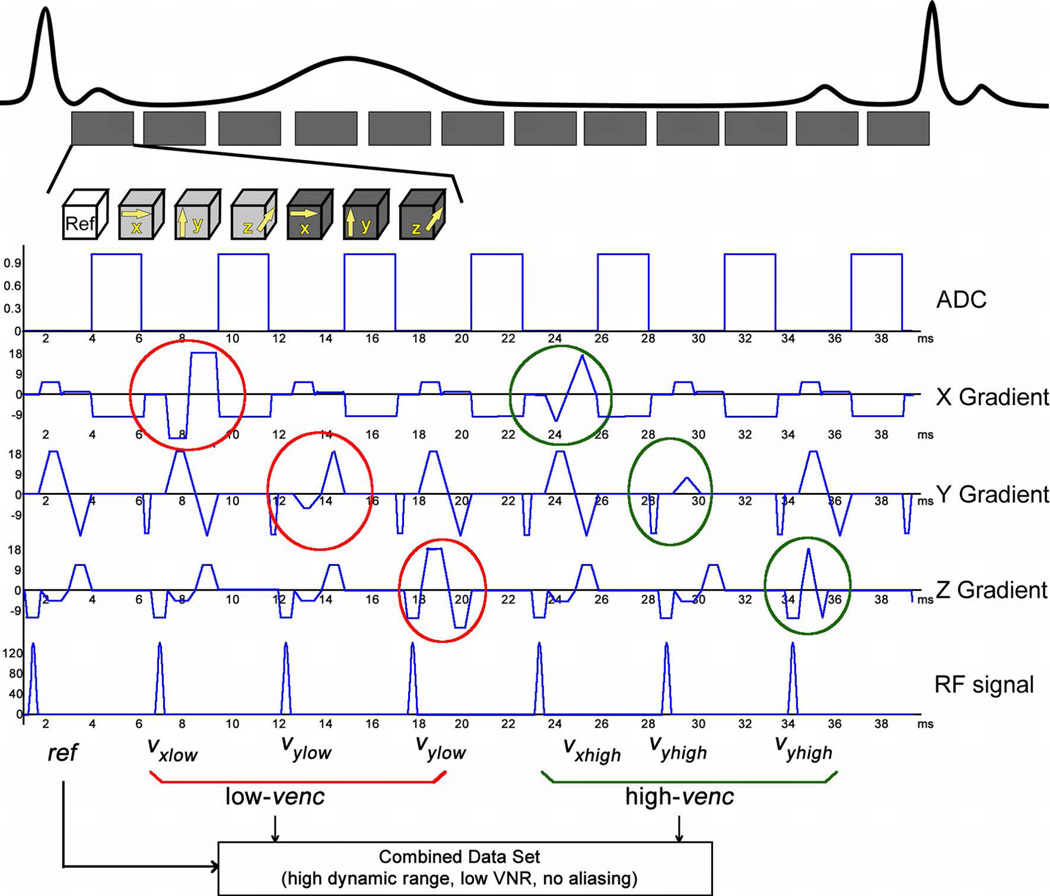
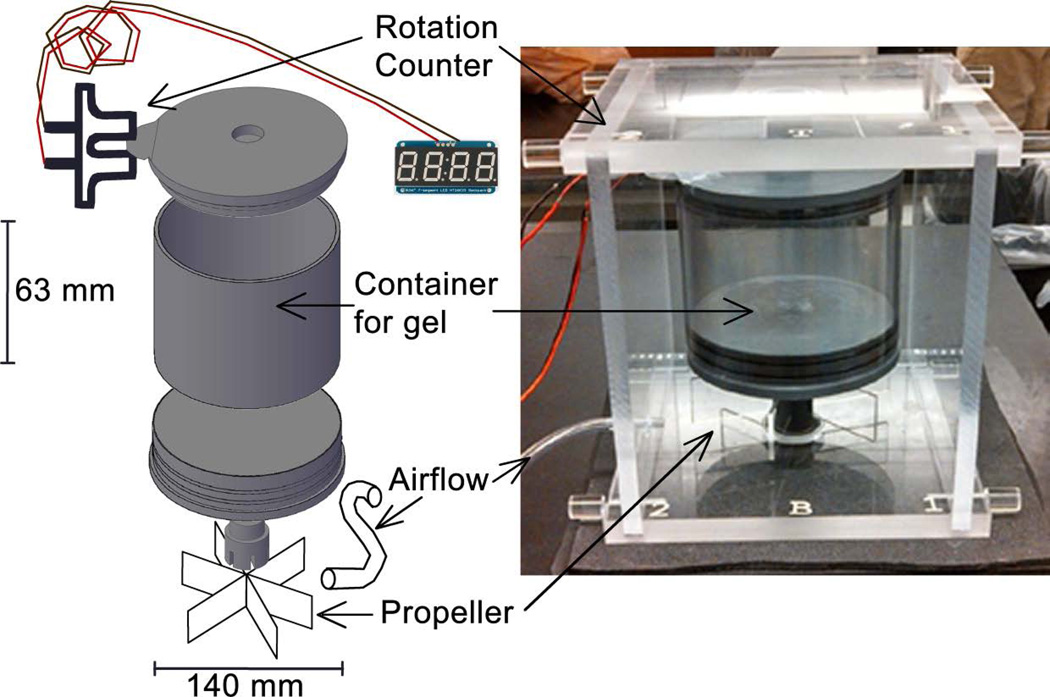
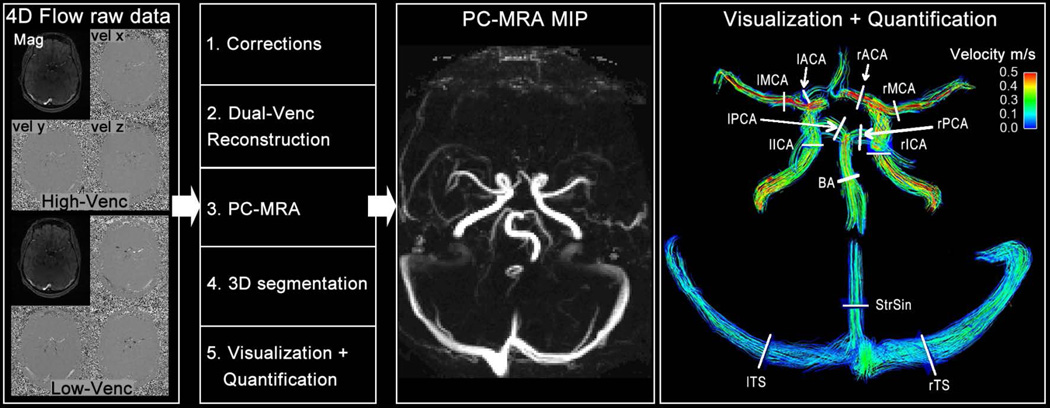
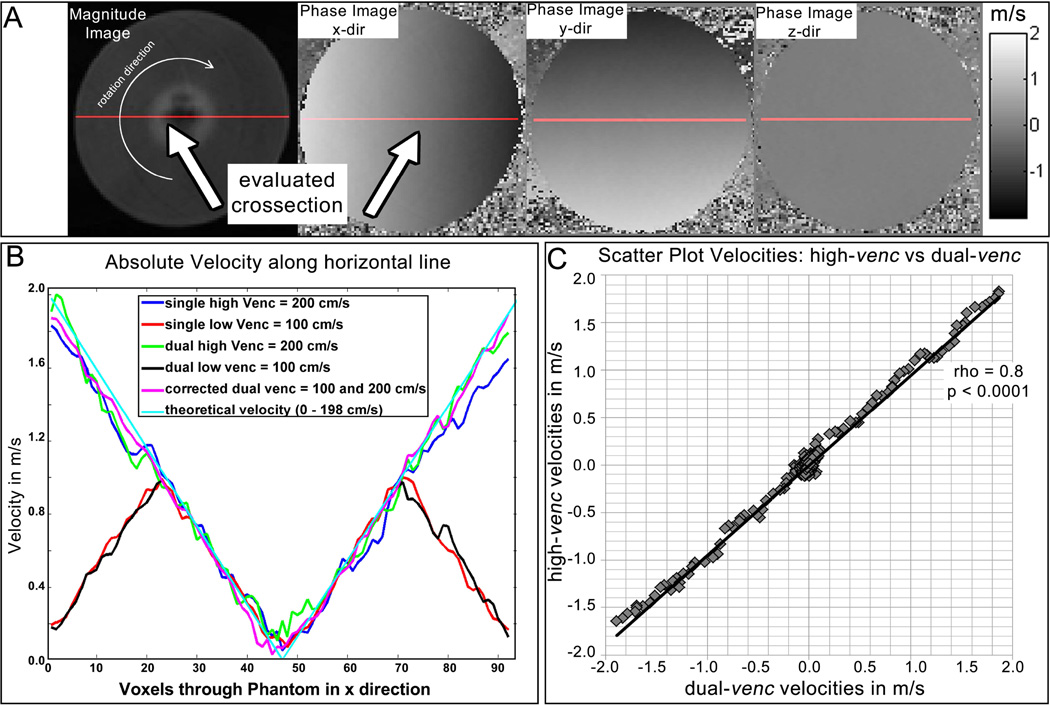
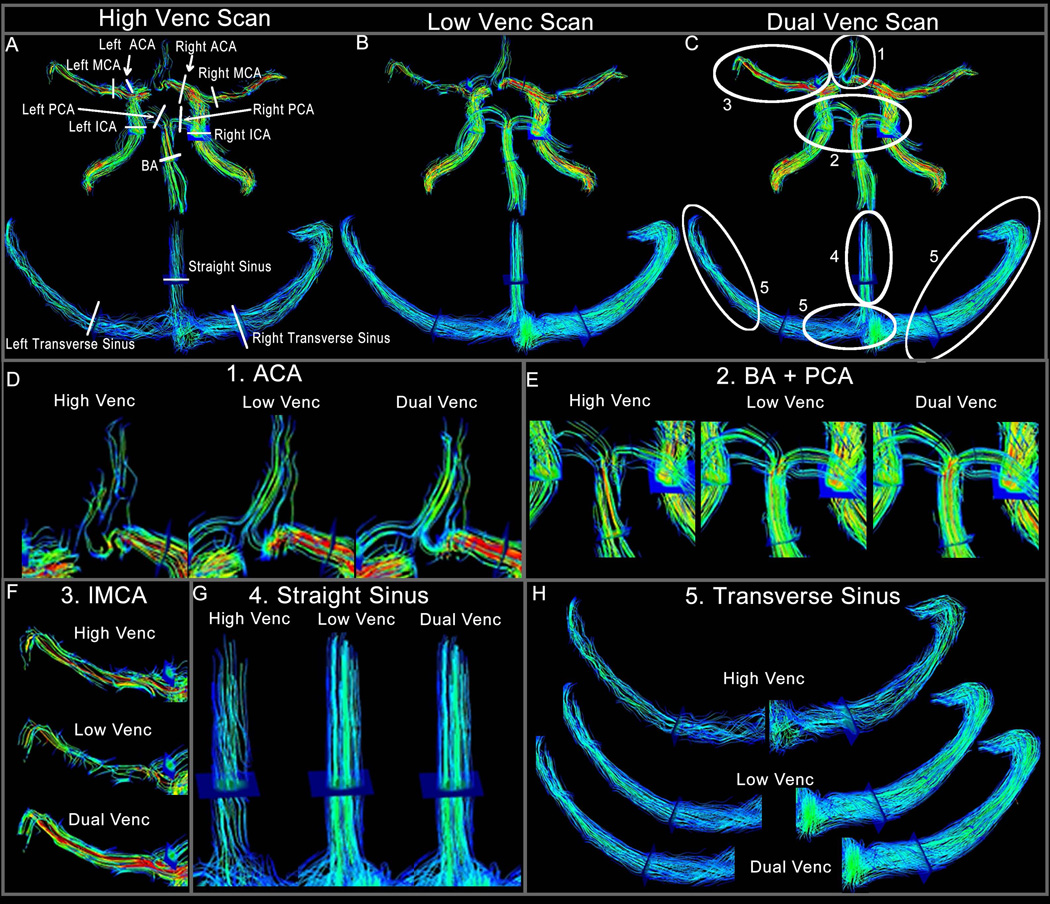
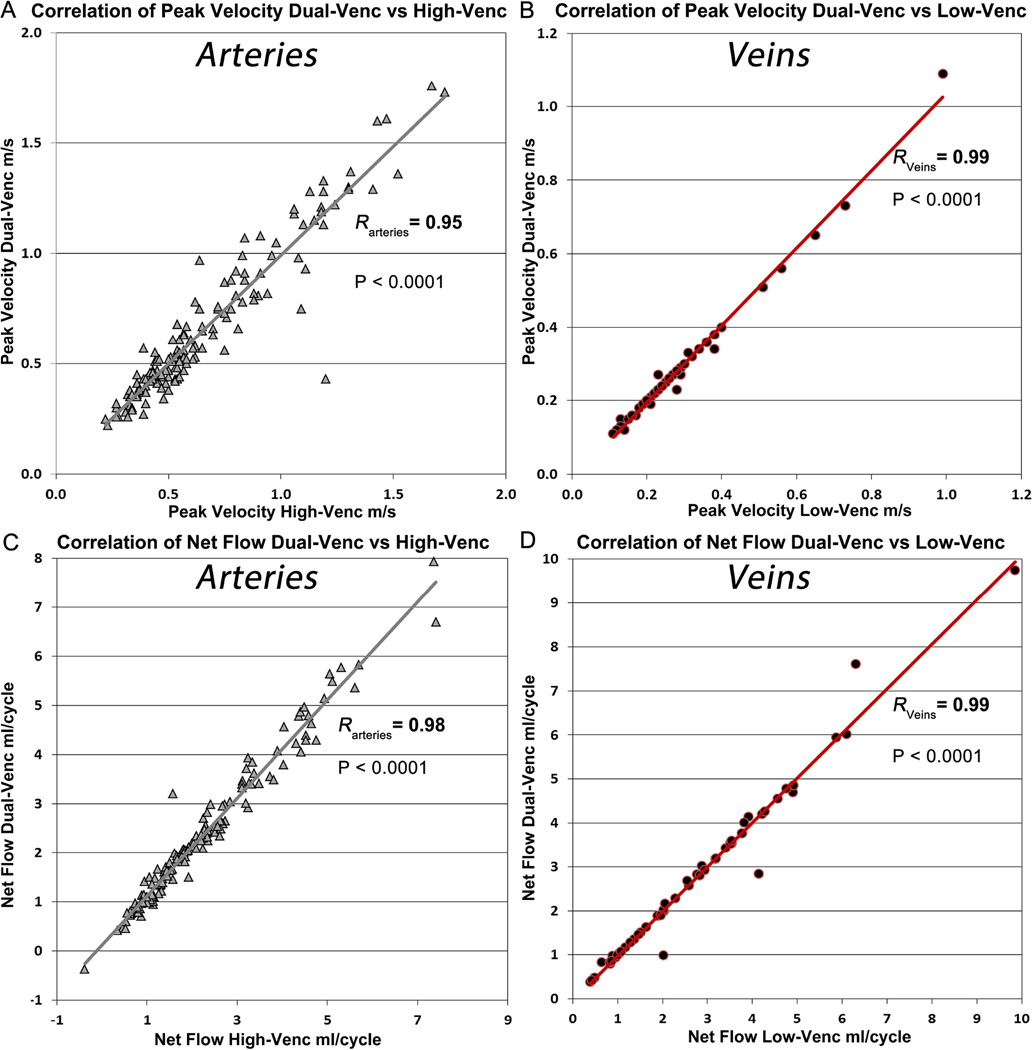
Materials and methods: A dual-venc 4D flow MRI sequence with k-t GRAPPA acceleration was developed using a shared reference scan followed by three-directional low- and high-venc scans (repetition time / echo time / flip angle = 6.1 msec / 3.4 msec / 15°, temporal/spatial resolution = 43.0 msec/1.2 × 1.2 × 1.2 mm3 ). The high-venc data were used to correct for aliasing in the low-venc data, resulting in a single dataset with the favorable VNR of the low-venc but without velocity aliasing. The sequence was validated with a 3T MRI scanner in phantom experiments and applied in 16 volunteers to investigate its feasibility for assessing intracranial hemodynamics (net flow and peak velocity) at the major intracranial vessels. In addition, image quality and image noise were assessed in the in vivo acquisitions.

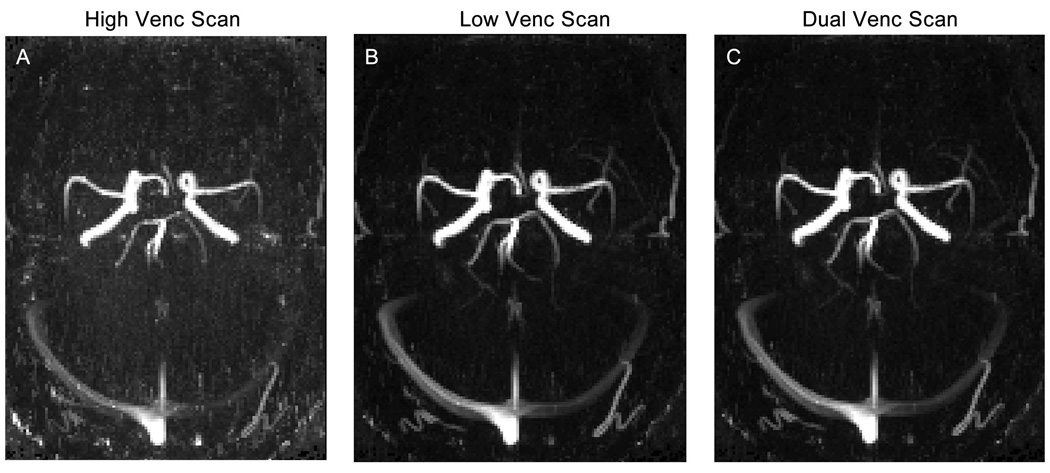
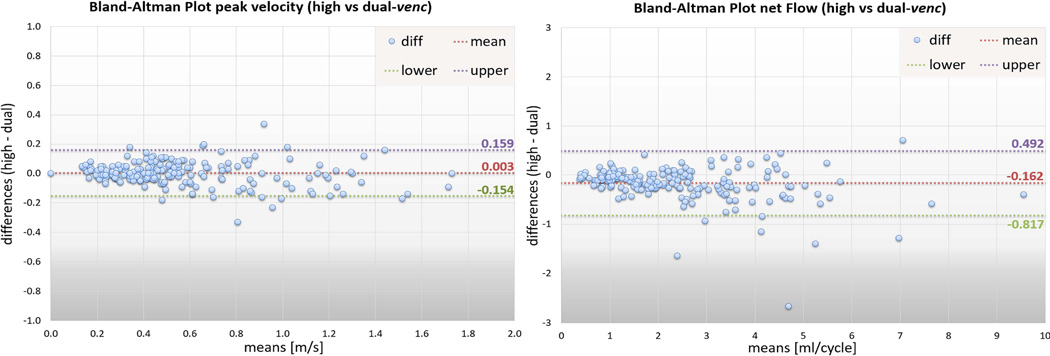
Results: All 4D flow MRI scans were acquired successfully with an acquisition time of 20 ± 4 minutes. The shared reference scan reduced the total acquisition time by 12.5% compared to two separate scans. Phantom experiments showed 51.4% reduced noise for dual-venc compared to high-venc and an excellent agreement of velocities (ρ = 0.8, P < 0.001). The volunteer data showed decreased noise in dual-venc data (54.6% lower) compared to high-venc, and improved image quality, as graded by two observers: fewer artifacts (P < 0.0001), improved vessel conspicuity (P < 0.0001), and reduced noise (P < 0.0001).

Conclusion: Dual-venc 4D flow MRI exhibits the superior VNR of the low-venc acquisition and reliably incorporates low- and high-velocity fields simultaneously. In vitro and in vivo data demonstrate improved flow visualization, image quality, and image noise.

Level of evidence: 2 Technical Efficacy: Stage 1 J. MAGN. RESON. IMAGING 2017;46:102-114.

Keywords: 4D flow MRI; PC-MRI; dual venc; intracranial 4D flow MRI; k-t GRAPPA.


Figures

Figure 1
Figure 1
Dual-venc PC-MRI sequence with a shared reference scan (ref) followed by low-venc and high-venc velocity encoding in three orthogonal directions (x, y, and z). A combined data set for each cardiac time frame was reconstructed utilizing the high VNR of the low-venc scan and the high-venc data for anti-aliasing. Note that a total of 7 TRs is needed to acquire one k-space line for dual-venc data compared to 8TRs that would be required for two separate low- and high-venc acquisitions.
Figure 2
Figure 2
Dual-venc phase contrast reconstruction using the low-venc scan (top row in (A)) as basis image and correcting the aliased voxels by comparing with the high-venc scan (second row in (A)) using a difference map (bottom row in (A)) and thresholds (B) to determine number of wrap arounds in the low-venc data. The resulting combined dual-venc data set without remaining aliasing artifact is shown in (C). The arrow in the image of the high-venc acquisition (A, second row) indicates the direction of rotation.
Figure 3
Figure 3
The rotation phantom consists of a container filled with contrast enhanced media. The container is driven by an air coupled propeller and rotations are counted with a photomicrosensor. Velocities varied linearly from 0 cm/s at the center to a maximum speed of 200 cm/s.
Figure 4
Figure 4
Magnitude and phase raw data of the low- and high-venc (left panel) is used to pre-process, reconstruct the dual-venc data set (Figure 3), calculate the PC-MRAs for all three acquisitions: low-, high- and dual-venc. The low-venc PC-MRA is used to segment the angiogram (MIMICS, Materialize, Belgium). From the PC-MRAs, the maximum intensity projection (MIP) is calculated along all spatial directions (second panel from right depict an axial MIP), which is used for qualitative grading. The segmented angiogram from the low-venc acquisition is used to mask velocities in all three data sets in order to get precise quantification of peak velocity and net flow at all defined locations (right panel): left and right internal carotid artery (lICA + rICA), left and right middle cerebral artery (lMCA + rMCA), left and right anterior cerebral artery (lACA + rACA), left and right posterior cerebral artery (lPCA + rPCA), basilar artery (BA), left and right transverse sinus (lTS + rTS) and straight sinus. The angiogram mask is also used to restrict the streamlines to the vessel boundaries for visualization of intracranial blood flow (right panel depicts streamlines at peak systole).
Figure 5
Figure 5
A. Magnitude and corresponding phase difference images of the rotation phantom in an axial cut plane. The cross section through the center of the phantom used for velocity quantification is shown by the red line. The arrow in the magnitude image indicates the direction of rotation. B. measured absolute along the cross section. The blue and green curves represent the high-venc scans measured with a venc of 200 cm/s, and the red and black lines represent the low-venc scans with aliasing at the outer voxels (venc = 100 cm/s). The magenta line represents the combined data set (dual-venc corrected scan) showing the result after dual-venc reconstruction. The cyan line corresponds to the calculated velocity assuming 198 cm/s at the outer diameter at 4.5 rev/s. C. Correlation of absolute velocities along the horizontal line for dual- vs high-venc shows a significant Spearman rank sum correlation of ρ = 0.8, indicating successful velocity anti-aliasing by dual-venc reconstruction.
Figure 6
Figure 6
Panels A–C show an example of one volunteer with 3D streamlines emitted from the entire angiogram volume for all three 4D flow scans (A high-venc, B low-venc and C dual-venc). The plane locations for flow quantification and quality assessment are illustrated in A. Those planes were also used to determine net flow and peak velocity. In panels D–H the areas in which dual-venc 4D-flow MRI provided superior flow visualization are zoomed. Panel D shows more as well as more coherent streamlines for the ACA. Panel E shows the BA and PCA, panel F shows disrupted streamlines in the low-venc, which are corrected in the dual-venc and panels G and E show examples of the slow flow venous system.
Figure 7
Figure 7
Example of the PC-MRA MIP for one volunteer, in A high-venc, B low-venc and C dual-venc.
Figure 8
Figure 8
The grey line depicts the correlation of peak velocity of dual-venc with high-venc (A) and the red line the correlation of dual-venc with low venc (B). (C) Correlation of net flow of dual-venc vs high-venc depicted with grey line. (D) Correlation of net flow dual-venc vs low-venc depicted with red line. R = Pearson correlation coefficient of the correlation.
Figure 9
Figure 9
Bland-Altman plots for peak velocity values in all vessels (left panel) as well as net flow values in all vessels (right panel) between the high- and dual-venc acquisitions.

References

    1. Wu C, Schnell S, Markl M, Ansari SA. Combined DSA and 4D Flow Demonstrate Overt Alterations of Vascular Geometry and Hemodynamics in an Unusually Complex Cerebral AVM. Clinical neuroradiology. 2015 - PubMed
    1. Wu C, Ansari SA, Honarmand AR, et al. Evaluation of 4D vascular flow and tissue perfusion in cerebral arteriovenous malformations: influence of Spetzler-Martin grade, clinical presentation, and AVM risk factors. AJNR American journal of neuroradiology. 2015;36(6):1142–1149. - PMC - PubMed
    1. Markl M, Wu C, Hurley MC, et al. Cerebral arteriovenous malformation: complex 3D hemodynamics and 3D blood flow alterations during staged embolization. Journal of magnetic resonance imaging : JMRI. 2013;38(4):946–950. - PubMed
    1. Schuchardt F, Schroeder L, Anastasopoulos C, et al. In vivo analysis of physiological 3D blood flow of cerebral veins. European radiology. 2015;25(8):2371–2380. - PubMed
    1. Harloff A, Zech T, Wegent F, Strecker C, Weiller C, Markl M. Comparison of blood flow velocity quantification by 4D flow MR imaging with ultrasound at the carotid bifurcation. AJNR American journal of neuroradiology. 2013;34(7):1407–1413. - PMC - PubMed

Publication types

MeSH terms