

microRNA-210-3p depletion by CRISPR/Cas9 promoted tumorigenesis through revival of TWIST1 in renal cell carcinoma
- PMID: 28152509
- PMCID: PMC5400553
- DOI: 10.18632/oncotarget.14930
microRNA-210-3p depletion by CRISPR/Cas9 promoted tumorigenesis through revival of TWIST1 in renal cell carcinoma
Abstract
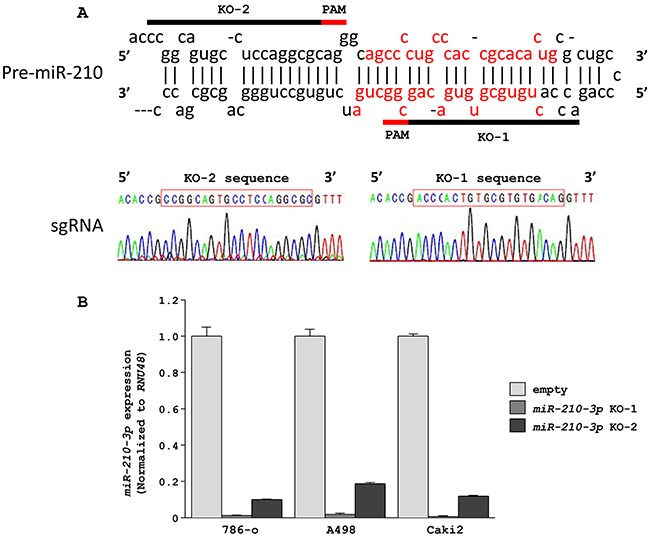
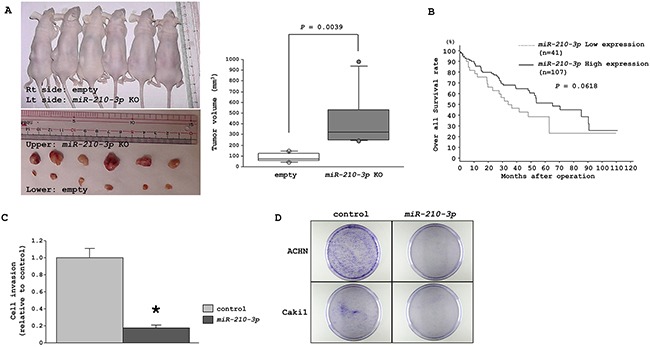
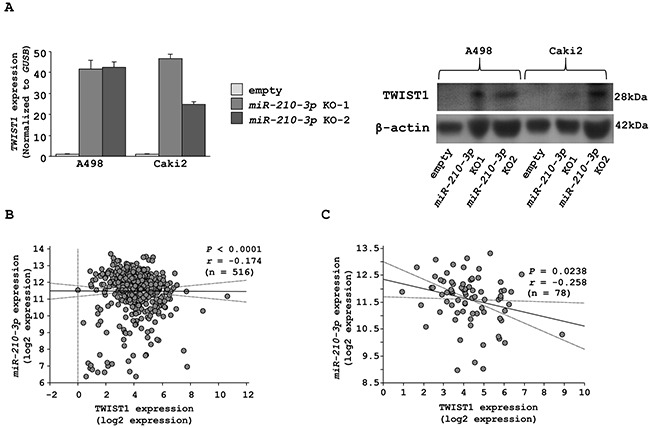
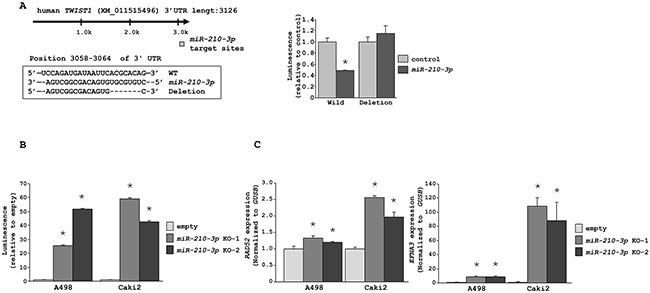
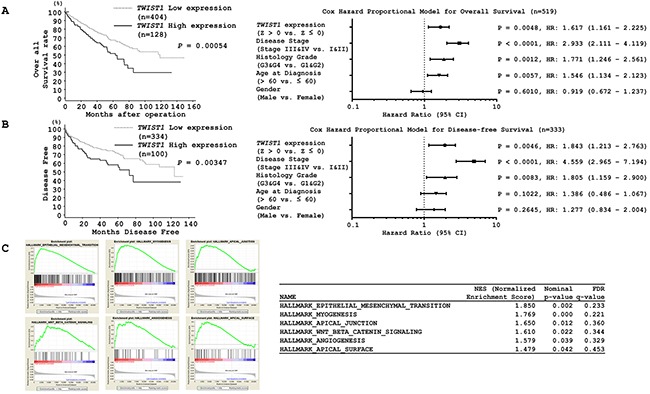
Previous studies showed that five miRNAs (miR-885-5p, miR-1274, miR-210-3p, miR-224 and miR-1290) were upregulated the most in clear cell renal cell carcinoma (ccRCC). Our focus was to understand from a clinical standpoint the functional consequences of upregulating miR-210-3p. Towards this, we utilized the CRISPR/Cas9 gene editing system to deplete miR-210-3p in RCC cell lines (786-o, A498 and Caki2) and characterized the outcomes. We observed that miR-210-3p depletion dramatically increased tumorigenesis, including altering the morphology of A498 and Caki2 cells in a manner characteristic of epithelial-mesenchymal transition (EMT). These results were corroborated by in vivo xenograft studies, which showed enhanced growth of tumors from miR-210-3p-depleted A498 cells. We identified Twist-related protein 1 (TWIST1) as a key target of miR-210-3p. Analysis of the ccRCC patient data in The Cancer Genome Atlas database showed a negative correlation between miR-210-3p and TWIST1 expression. High TWIST1 and low miR-210-3p expression associated with poorer overall and disease-free survival as compared to low TWIST1 and high miR-210-3p expression. These findings suggest that renal cell carcinoma progression is promoted by TWIST1 suppression mediated by miR-210-3p.
Keywords: CRISPR/Cas9; TWIST1; miR-210-3p; microRNA; renal cell carcinoma.
Conflict of interest statement
The authors indicated no potential conflicts of interest.
Figures


Similar articles
-
lncRNA JPX/miR-33a-5p/Twist1 axis regulates tumorigenesis and metastasis of lung cancer by activating Wnt/β-catenin signaling.Mol Cancer. 2020 Jan 15;19(1):9. doi: 10.1186/s12943-020-1133-9. Mol Cancer. 2020. PMID: 31941509 Free PMC article.
-
Epithelial-mesenchymal transition associated markers in sarcomatoid transformation of clear cell renal cell carcinoma.Exp Mol Pathol. 2024 Aug;138:104909. doi: 10.1016/j.yexmp.2024.104909. Epub 2024 Jun 13. Exp Mol Pathol. 2024. PMID: 38876079
-
SNHG12 promotes carcinogenesis of human renal cell cancer via functioning as a competing endogenous RNA and sponging miR-30a-3p.J Cell Mol Med. 2021 May;25(10):4696-4708. doi: 10.1111/jcmm.16417. Epub 2021 Mar 30. J Cell Mol Med. 2021. PMID: 33787057 Free PMC article.
-
The biological roles and clinical implications of microRNAs in clear cell renal cell carcinoma.J Cell Physiol. 2018 Jun;233(6):4458-4465. doi: 10.1002/jcp.26347. Epub 2017 Dec 26. J Cell Physiol. 2018. PMID: 29215721 Review.
-
The role of TWIST1 in epithelial-mesenchymal transition and cancers.Tumour Biol. 2016 Jan;37(1):185-97. doi: 10.1007/s13277-015-4450-7. Epub 2015 Nov 24. Tumour Biol. 2016. PMID: 26602382 Review.
Cited by
-
MicroRNA Therapeutics in Cancer: Current Advances and Challenges.Cancers (Basel). 2021 May 29;13(11):2680. doi: 10.3390/cancers13112680. Cancers (Basel). 2021. PMID: 34072348 Free PMC article. Review.
-
Secreted miR-210-3p as non-invasive biomarker in clear cell renal cell carcinoma.Oncotarget. 2017 Jun 13;8(41):69551-69558. doi: 10.18632/oncotarget.18449. eCollection 2017 Sep 19. Oncotarget. 2017. PMID: 29050224 Free PMC article.
-
Knockdown of microRNA-214-3p Promotes Tumor Growth and Epithelial-Mesenchymal Transition in Prostate Cancer.Cancers (Basel). 2021 Nov 23;13(23):5875. doi: 10.3390/cancers13235875. Cancers (Basel). 2021. PMID: 34884984 Free PMC article.
-
MiR-210-3p inhibits the tumor growth and metastasis of bladder cancer via targeting fibroblast growth factor receptor-like 1.Am J Cancer Res. 2017 Aug 1;7(8):1738-1753. eCollection 2017. Am J Cancer Res. 2017. PMID: 28861329 Free PMC article.
-
Prognostic Value of Tumor Tissue Up-regulated microRNAs in Clear Cell Renal Cell Carcinoma (ccRCC).In Vivo. 2024 Jul-Aug;38(4):1799-1805. doi: 10.21873/invivo.13631. In Vivo. 2024. PMID: 38936941 Free PMC article.
References
-
- Gupta K, Miller JD, Li JZ, Russell MW, Charbonneau C. Epidemiologic and socioeconomic burden of metastatic renal cell carcinoma (mRCC): a literature review. Cancer Treat Rev. 2008;34:193–205. - PubMed
-
- Naito S, Tomita Y, Rha SY, Uemura H, Oya M, Song HZ, Zhong LH, Wahid MI. Kidney Cancer Working Group report. Jpn J Clin Oncol. 2010;40(Suppl 1):i51–56. - PubMed
-
- Filipowicz W, Bhattacharyya SN, Sonenberg N. Mechanisms of post-transcriptional regulation by microRNAs: are the answers in sight? Nat Rev Genet. 2008;9:102–114. - PubMed
MeSH terms
Substances
LinkOut - more resources
Full Text Sources
Other Literature Sources
Medical
Research Materials
