. 2017 Feb 2;18(1):84.
doi: 10.1186/s12859-017-1501-7.

Mixture model normalization for non-targeted gas chromatography/mass spectrometry metabolomics data

Affiliations

Mixture model normalization for non-targeted gas chromatography/mass spectrometry metabolomics data

Anna C Reisetter et al. BMC Bioinformatics. .

Abstract

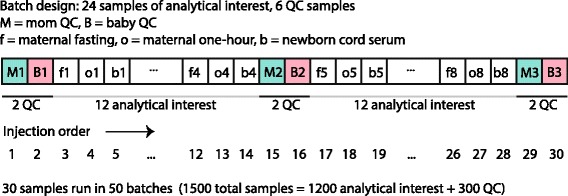
Background: Metabolomics offers a unique integrative perspective for health research, reflecting genetic and environmental contributions to disease-related phenotypes. Identifying robust associations in population-based or large-scale clinical studies demands large numbers of subjects and therefore sample batching for gas-chromatography/mass spectrometry (GC/MS) non-targeted assays. When run over weeks or months, technical noise due to batch and run-order threatens data interpretability. Application of existing normalization methods to metabolomics is challenged by unsatisfied modeling assumptions and, notably, failure to address batch-specific truncation of low abundance compounds.

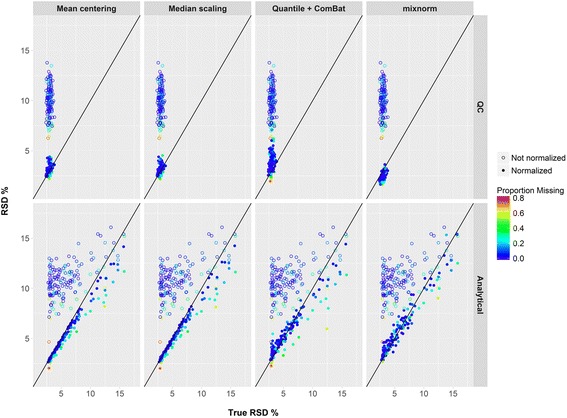
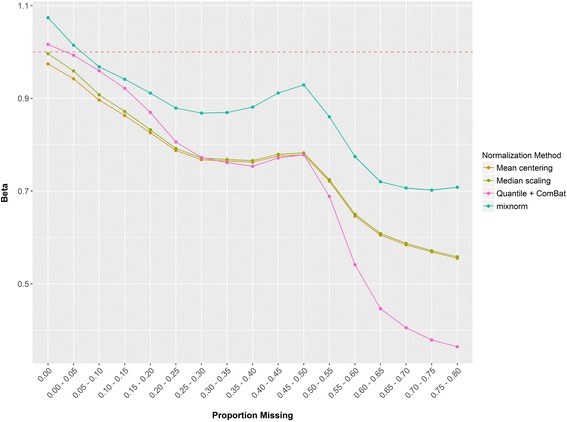
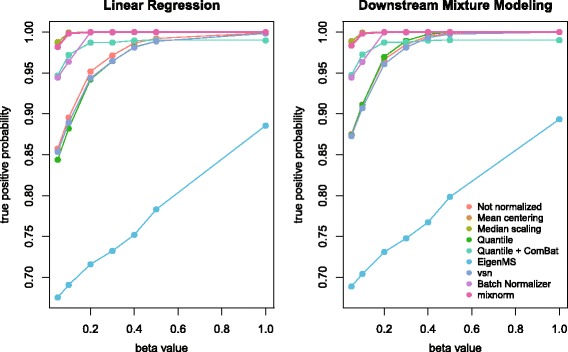
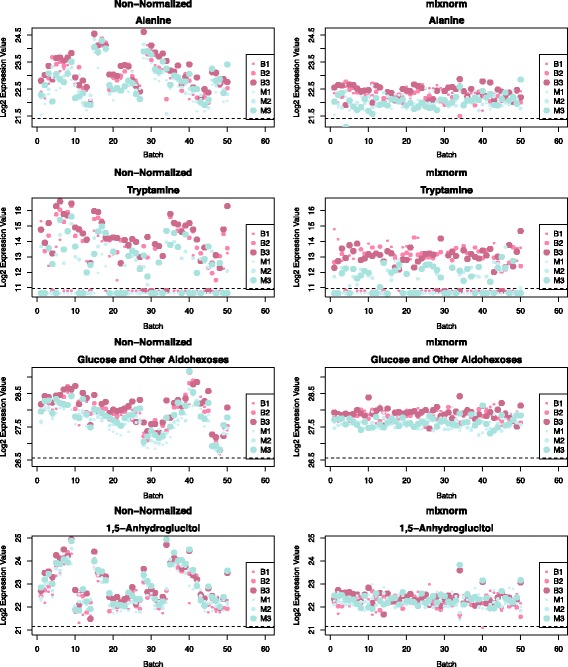
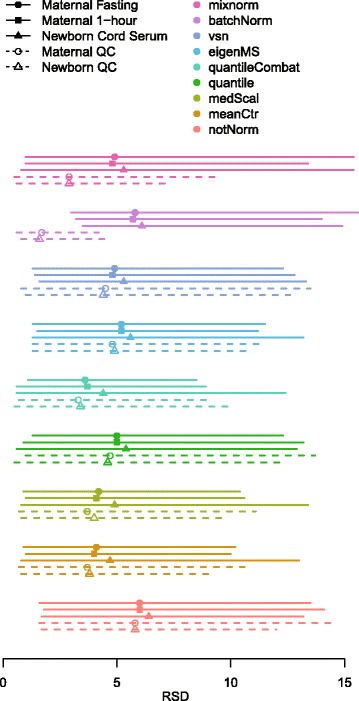
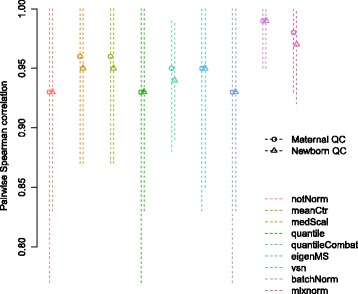
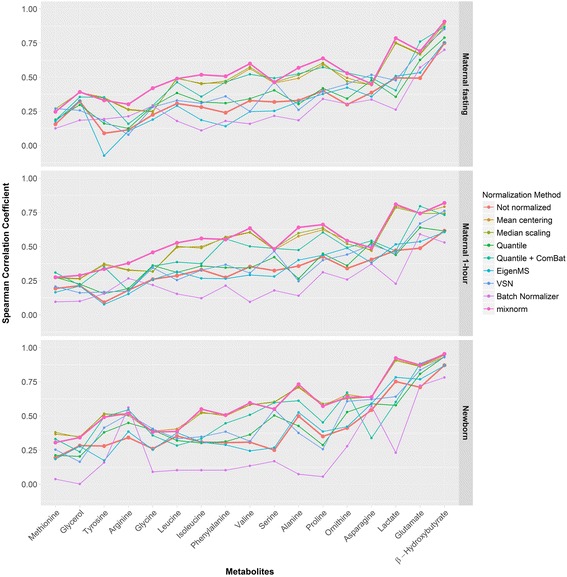
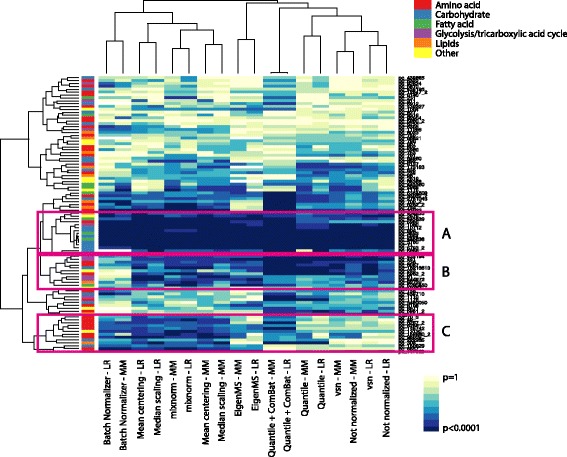
Results: To curtail technical noise and make GC/MS metabolomics data amenable to analyses describing biologically relevant variability, we propose mixture model normalization (mixnorm) that accommodates truncated data and estimates per-metabolite batch and run-order effects using quality control samples. Mixnorm outperforms other approaches across many metrics, including improved correlation of non-targeted and targeted measurements and superior performance when metabolite detectability varies according to batch. For some metrics, particularly when truncation is less frequent for a metabolite, mean centering and median scaling demonstrate comparable performance to mixnorm.

Conclusions: When quality control samples are systematically included in batches, mixnorm is uniquely suited to normalizing non-targeted GC/MS metabolomics data due to explicit accommodation of batch effects, run order and varying thresholds of detectability. Especially in large-scale studies, normalization is crucial for drawing accurate conclusions from non-targeted GC/MS metabolomics data.

Keywords: Batch effects; GC/MS; Gas chromatography/mass spectrometry; Metabolomics; Non-targeted; Normalization.


Figures

Fig. 1
Fig. 1
Schematic representation of run order within batch for the HAPO Metabolomics study. Data include 1200 analytical samples (400 maternal fasting, 400 maternal 1-hour, 400 newborn cord serum) of interest and 300 QCs (150 maternal, 150 newborn) processed in 50 batches of 30 samples each. Maternal samples placed at the beginning, middle and end of each batch are labeled M1, M2 and M3, respectively. Newborn (or baby) samples placed at the beginning, middle and end of each batch are labeled B1, B2 and B3, respectively. In a batch of total size 30, maternal QCs were placed at run order 1, 15 and 29 and newborn QCs were placed at run order 2, 16 and 30. Maternal / newborn sample triples were run in sequence with 8 sets of triples included in each batch
Fig. 2
Fig. 2
An example of one round of simulation results (simulation 316) comparing calculated RSD for metabolites in QC and analytical samples before normalization (open circles) and RSD after normalization for four different methods (closed circles) v. true RSD prior to inclusion of batch effects and batch-specific detection thresholds in the simulation. Points are colored according to the proportion of undetected levels in the simulation for that metabolite. The black line indicates perfect correspondence of true and estimated RSD
Fig. 3
Fig. 3
A plot of beta estimates from simple no-intercept linear regression models using simulation data. Calculated RSD after normalization was treated as the outcome and true RSD prior to inclusion of batch effects and batch-specific detection thresholds in the simulation was treated as the predictor. A beta value of 1 indicates perfect correspondence with beta values <1 (>1) indicating under- (over-) estimation of RSD by the normalization method. Betas are plotted according to increasing amounts of missing data, i.e. the proportion of simulated undetected values for a given metabolite
Fig. 4
Fig. 4
Plots of true positive probabilities (y-axis) under both linear regression and downstream mixture model analyses for detecting true associations in simulated data prior to and following normalization. Values on the x-axis represent the magnitude of association with the simulated phenotype according the simulated beta values. True positive probabilities are plotted for beta values with absolute value greater than or equal to 0.05, 0.1, 0.2, 0.3, 0.4, 0.5 and 1.0
Fig. 5
Fig. 5
Log 2 peak areas for QC samples in HAPO Metabolomics across all 50 batches. Data are presented for peaks annotated as alanine, tryptamine, glucose and other aldohexoses and 1,5-anhydroglucitol. The first column contains original non-normalized observations and the second column contains mixnorm-normalized values. Small, medium and large blue dots correspond to maternal QC samples placed at the beginning (M1), middle (M2) and end (M3) of each batch, respectively. Small, medium and large pink dots correspond to newborn QC samples placed at the beginning (B1), middle (B2) and end (B3) of each batch, respectively. Dots below the dotted line represent values below the detection threshold for a given batch
Fig. 6
Fig. 6
RSD values (%) for analytical (maternal fasting, maternal 1-hour, newborn cord serum) and QC (maternal QC, newborn QC) data in HAPO Metabolomics prior to and following normalization with each approach. Points correspond to the mean RSD and lines span the minimum to the maximum RSD for each sample type
Fig. 7
Fig. 7
Pairwise Spearman correlation values for maternal and newborn QC samples in HAPO Metabolomics prior to and following normalization with each approach. Points correspond to the mean pairwise Spearman correlation value and lines span the minimum to the maximum pairwise Spearman correlation for each sample type. All Spearman correlation estimates are statistically significantly different from 0 with p < 0.05
Fig. 8
Fig. 8
Spearman correlation coefficients for non-targeted and targeted data. Correlation estimates are plotted for non-targeted metabolites using each normalization method and their conventional metabolite or targeted amino acid counterparts. Results are presented separately for each analytical sample type. All Spearman correlation estimates are statistically significantly different from 0 with p < 0.05 with the exception of tyrosine after EigenMS normalization in maternal fasting samples and methionine, glycerol, alanine and proline after Batch Normalizer in cord serum samples
Fig. 9
Fig. 9
Heatmap of associations with maternal fasting plasma glucose (FPG) for fasting maternal metabolites in HAPO Metabolomics. The colors on the heatmap correspond to the strength of association with dark blue representing p-values close to 0 and light yellow representing p-values close to 1. Associations were detected using both linear regression and downstream mixture modeling prior to and following normalization with each approach. Hierarchical clustering was applied to columns and rows. Columns are close to each other for methods that detect similar associations. Rows are close each other if the strength of detected associations for the metabolites (represented by PubChem ID starting with ‘pc_’) are similar across the range of methods. Compound classes for each metabolite are represented by the lefthand vertical bar (red – amino acids; blue – carbohydrates; green – fatty acids; purple – glycolysis/tricarboxylic acid cycle; orange – lipids; yellow – other). Pink boxes A, B and C highlight clusters of metabolites detected by different sets of normalization approaches

References

    1. Dunn WR, Broadhurst D, Begley P, Zelena E, Francis-McIntyre S, Anderson N, Brown M, Knowles JD, Halsall A, Haselden JN, et al. Procedures for large-scale metabolic profiling of serum and plasma using has chromatography and liquid chromatography coupled to mass spectrometry. Nat Protoc. 2011;6(7):1060–83. doi: 10.1038/nprot.2011.335. - DOI - PubMed
    1. Saigusa D, Okamura Y, Motoike IN, Katoh Y, Kurosawa Y, Saijyo R, Koshiba S, Yasuda J, Motohashi H, Sugawara J, et al. Establishment of protocols for global metabolomics by LC-MS for biomarker discovery. PLoS One. 2016;11(8):e0160555. doi: 10.1371/journal.pone.0160555. - DOI - PMC - PubMed
    1. Malm L, Tybring G, Moritz T, Landin B, Galli J. Metabolomic quality assessment of EDTA plasma and serum samples. Biopreserv Biobank. 2016;14(5):416–23. doi: 10.1089/bio.2015.0092. - DOI - PubMed
    1. López-Bascón MA, Priego-Capote F, Peralbo-Molina A, Calderón-Santiago M, Luque de Castro MD. Influence of the collection tube on metabolomic changes in serum and plasma. Talanta. 2016;150:681–9. doi: 10.1016/j.talanta.2015.12.079. - DOI - PubMed
    1. Hirayama A, Sugimoto M, Suzuki A, Hatakeyama Y, Enomoto A, Harada S, Soga T, Tomita M, Takebayashi T. Effects of processing and storage conditions on changed metabolomic profiles in blood. Electrophoresis. 2015;36(18):2148–55. doi: 10.1002/elps.201400600. - DOI - PubMed

LinkOut - more resources