

From HIV infection to therapeutic response: a population-based longitudinal HIV cascade-of-care study in KwaZulu-Natal, South Africa
- PMID: 28153470
- PMCID: PMC5964602
- DOI: 10.1016/S2352-3018(16)30224-7
From HIV infection to therapeutic response: a population-based longitudinal HIV cascade-of-care study in KwaZulu-Natal, South Africa
Abstract
Background: Standard approaches to estimation of losses in the HIV cascade of care are typically cross-sectional and do not include the population stages before linkage to clinical care. We used indiviual-level longitudinal cascade data, transition by transition, including population stages, both to identify the health-system losses in the cascade and to show the differences in inference between standard methods and the longitudinal approach.
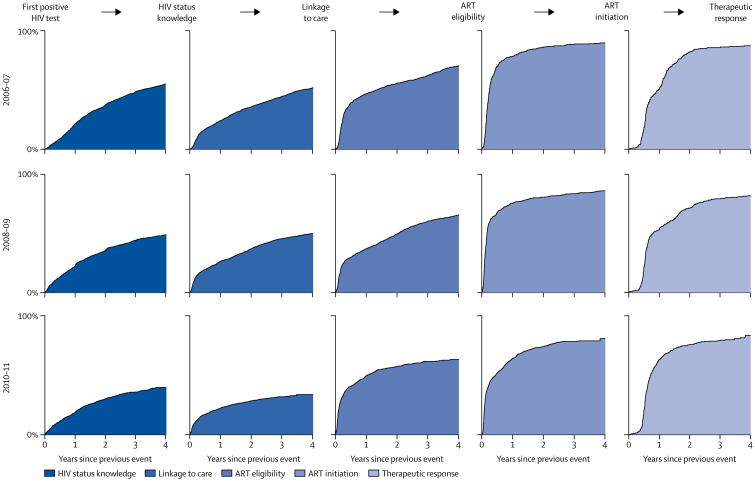
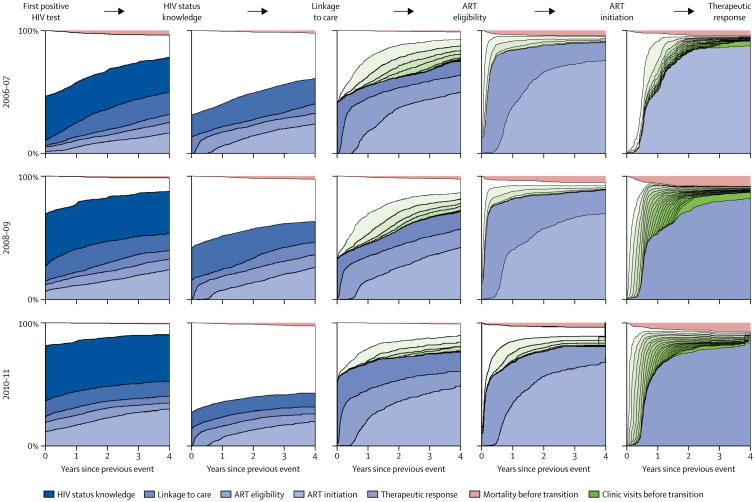
Methods: We used non-parametric survival analysis to estimate a longitudinal HIV care cascade for a large population of people with HIV residing in rural KwaZulu-Natal, South Africa. We linked data from a longitudinal population health surveillance (which is maintained by the Africa Health Research Institute) with patient records from the local public-sector HIV treatment programme (contained in an electronic clinical HIV treatment and care database, ARTemis). We followed up all people who had been newly detected as having HIV between Jan 1, 2006, and Dec 31, 2011, across six cascade stages: three population stages (first positive HIV test, HIV status knowledge, and linkage to care) and three clinical stages (eligibility for antiretroviral therapy [ART], initiation of ART, and therapeutic response). We compared our estimates to cross-sectional cascades in the same population. We estimated the cumulative incidence of reaching a particular cascade stage at a specific time with Kaplan-Meier survival analysis.
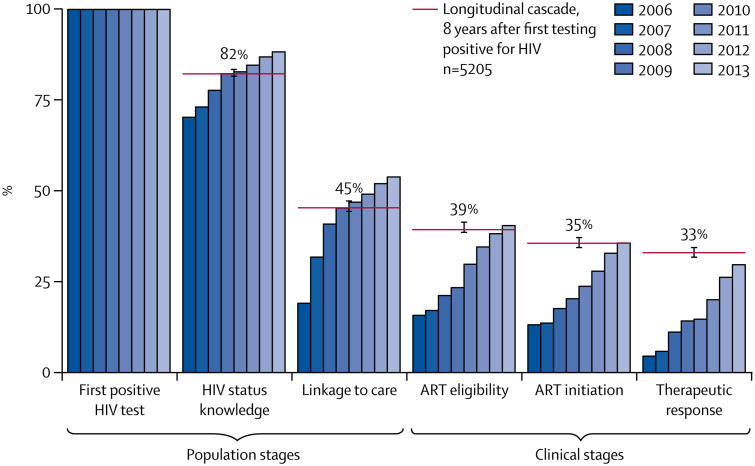
Findings: Our population consisted of 5205 individuals with HIV who were followed up for 24 031 person-years. We recorded 598 deaths. 4539 individuals gained knowledge of their positive HIV status, 2818 were linked to care, 2151 became eligible for ART, 1839 began ART, and 1456 had successful responses to therapy. We used Kaplan-Meier survival analysis to adjust for censorship due to the end of data collection, and found that 8 years after testing positive in the population health surveillance, 16% had died. Among living patients, 82% knew their HIV status, 45% were linked to care, 39% were eligible for ART, 35% initiated ART, and 33% had reached therapeutic response. Median times to transition for these cascade stages were 52 months, 52 months, 20 months, 3 months, and 9 months, respectively. Compared with the population stages in the cascade, the transitions across the clinical stages were fast. Over calendar time, rates of linkage to care have decreased and patients presenting for the first time for care were, on average, healthier.
Interpretation: HIV programmes should focus on linkage to care as the most important bottleneck in the cascade. Cascade estimation should be longitudinal rather than cross-sectional and start with the population stages preceding clinical care.
Funding: Wellcome Trust, PEPFAR.
Copyright © 2017 Elsevier Ltd. All rights reserved.
Figures
Comment in
-
Is 90-90-90 achievable?Lancet HIV. 2017 May;4(5):e193-e194. doi: 10.1016/S2352-3018(16)30212-0. Epub 2017 Jan 31. Lancet HIV. 2017. PMID: 28153471 No abstract available.
References
-
- WHO. Global update on HIV treatment 2013: results, impact, and opportunities. Geneva: World Health Organization; 2013.
-
- Alvarez-Uria G, Pakam R, Midde M, Naik PK. Entry, retention, and virological suppression in an HIV cohort study in India: description of the cascade of care and implications for reducing HIV-related mortality in low- and middle-income countries. Interdiscip Perspect Infect Dis. 2013;2013:384805. - PMC - PubMed
Publication types
MeSH terms
Substances
Grants and funding
LinkOut - more resources
Full Text Sources
Other Literature Sources
Medical
Research Materials
