. 2017 Mar;173(3):1763-1782.
doi: 10.1104/pp.16.01605. Epub 2017 Feb 2.

The Sites of Evaporation within Leaves

Affiliations

The Sites of Evaporation within Leaves

Thomas N Buckley et al. Plant Physiol. 2017 Mar.

Abstract

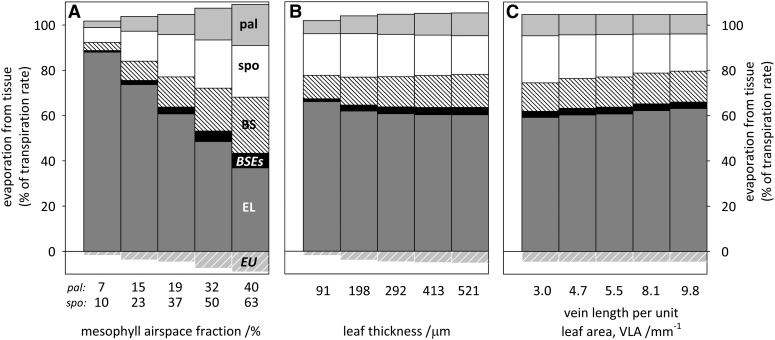
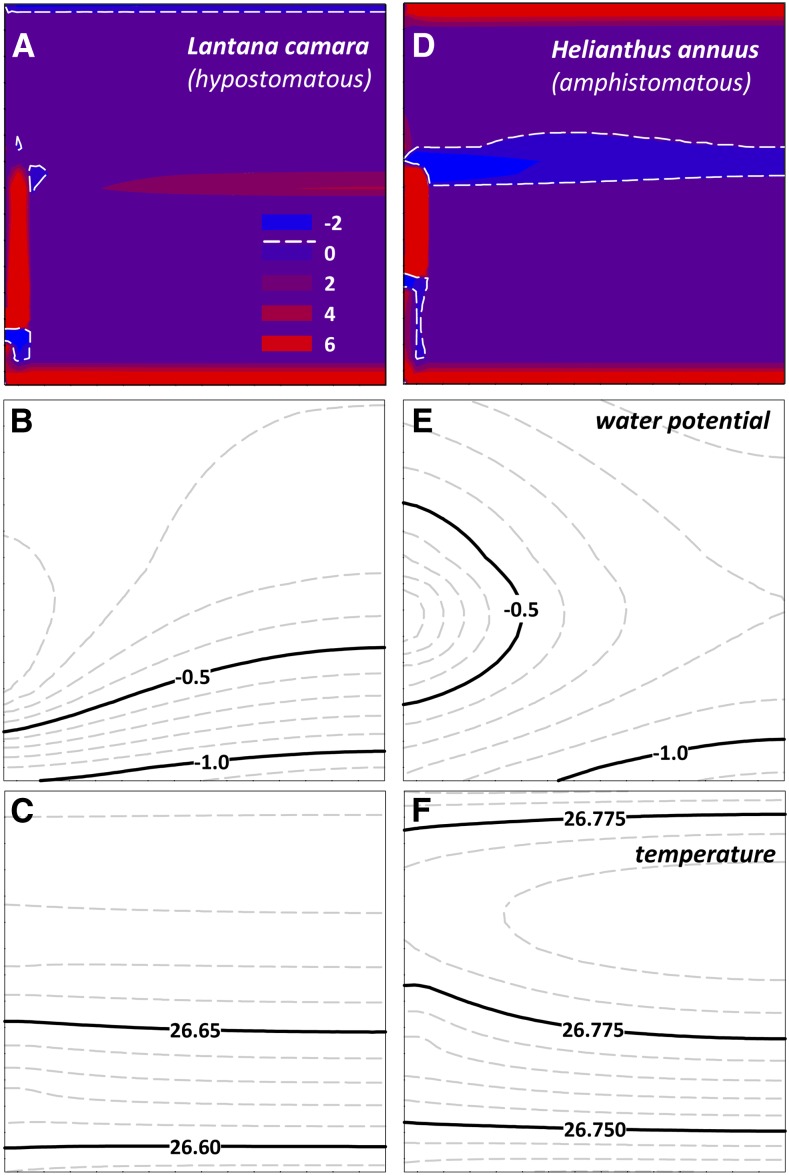
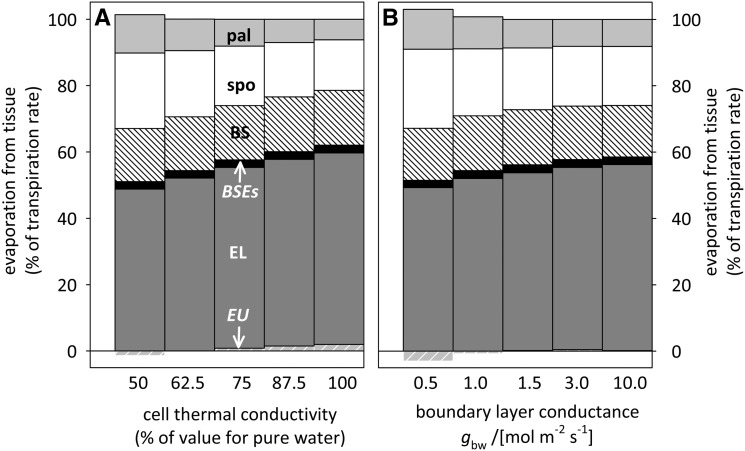
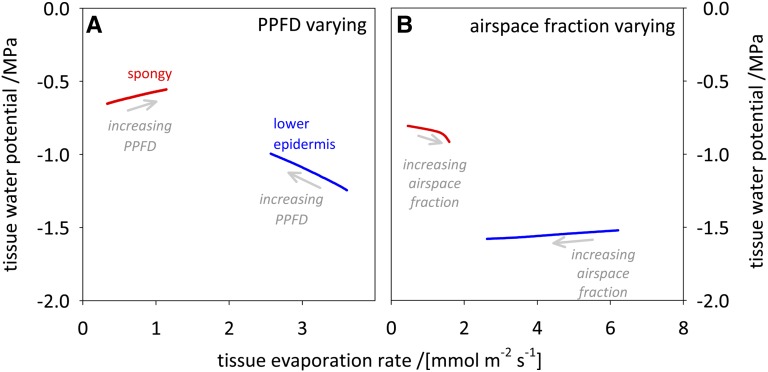
The sites of evaporation within leaves are unknown, but they have drawn attention for decades due to their perceived implications for many factors, including patterns of leaf isotopic enrichment, the maintenance of mesophyll water status, stomatal regulation, and the interpretation of measured stomatal and leaf hydraulic conductances. We used a spatially explicit model of coupled water and heat transport outside the xylem, MOFLO 2.0, to map the distribution of net evaporation across leaf tissues in relation to anatomy and environmental parameters. Our results corroborate earlier predictions that most evaporation occurs from the epidermis at low light and moderate humidity but that the mesophyll contributes substantially when the leaf center is warmed by light absorption, and more so under high humidity. We also found that the bundle sheath provides a significant minority of evaporation (15% in darkness and 18% in high light), that the vertical center of amphistomatous leaves supports net condensation, and that vertical temperature gradients caused by light absorption vary over 10-fold across species, reaching 0.3°C. We show that several hypotheses that depend on the evaporating sites require revision in light of our findings, including that experimental measurements of stomatal and hydraulic conductances should be affected directly by changes in the location of the evaporating sites. We propose a new conceptual model that accounts for mixed-phase water transport outside the xylem. These conclusions have far-reaching implications for inferences in leaf hydraulics, gas exchange, water use, and isotope physiology.


Figures

Figure 1.
Figure 1.
Spatial distribution of evaporation (A and D), ψ (MPa; B and E), and T (°C; C and F) across outside-xylem leaf tissues for B. galpinii (A–C) and H. arbutifolia (D–F). In A and D, the contours represent evaporation rate from each node in the grid (which represents a finite volume of tissue within the areole) as a percentage of the transpiration rate of the leaf area subtended by that node; dashed lines indicate net evaporation of zero. The diagram at top left shows the approximate location of each tissue type. Transdermal micrographs are shown with scale bars for each species to illustrate the large differences in leaf anatomy and dimensions between the two species. Dashed white lines in A and D indicate the boundary between regions with net evaporation and regions with net condensation. Tissue-specific percentage contributions to total evaporation rate were as follows (in the order lower epidermis, spongy mesophyll, palisade mesophyll, BS, and upper epidermis): for B. galpinii, 88.4, 6.4, 2.4, 3.4, and −0.9; for H. arbutifolia, 36.6, 26.5, 9.9, 32.3, and −6.7.
Figure 2.
Figure 2.
Effects of variations in tissue-scale parameters on evaporation among tissues: mesophyll airspace fraction (A), leaf thickness (B), and minor VLA (C). Each parameter was varied from the minimum to the maximum value observed across the 14 species listed in Table III while holding all other anatomical parameters constant at their all-species averages. pal, Palisade mesophyll; spo, spongy mesophyll; BSEs, BS extensions, or in homobaric species, mesophyll directly above and below the BS; EL, lower epidermis; EU, upper epidermis.
Figure 3.
Figure 3.
Simulated spatial distributions of evaporation (A and D), ψ (B and E), and T (C and F) in a hypostomatous species, L. camara (A–C), and an amphistomatous species, H. annuus (D–F). Colors, lines, and tissue orientations are as in Figures 1 and 8. In A and D, the contours represent evaporation rate from each node in the grid as a percentage of the transpiration rate of the leaf area subtended by that node. Dashed white lines indicate the boundary between regions with net evaporation and regions with net condensation; thus, the zone in the approximate vertical center of the H. annuus leaf experiences net condensation rather than evaporation. Default values were used for all parameters and conditions. Tissue-specific percentage contributions to total evaporation rate were as follows (in the order lower epidermis, spongy mesophyll, palisade mesophyll, BS, and upper epidermis): for L. camara, 62.7, 15, 7.1, 18.8, and −3.8; for H. annuus, 25.8, 11.1, 9.4, 20.9, and 26.7. In H. annuus, 58.2% of transpiration was assumed to occur from the lower (abaxial) surface.
Figure 4.
Figure 4.
Effects of changes in anatomical parameters during dehydration, from full turgor (FT) to turgor loss point (TLP), for three species, with abbreviations as in Figure 2. Anatomical parameter changes are described in Supplemental Table S1.
Figure 5.
Figure 5.
Effects of liquid transport parameters on the distribution of evaporation across leaf tissues, with abbreviations as in Figure 2. A, Pm. B, Ra. C, Percentage by which apoplastic transport across the BS is assumed to be suppressed by suberization and/or lignification of cell walls. All anatomical parameters were set at their all-species average values (Supplemental Table S2).
Figure 6.
Figure 6.
Effects of variation in environmental parameters on the distribution of evaporation across outside-xylem leaf tissues. A, PPFD. B, wair. C, Tair. Abbreviations are as in Figure 2. All anatomical parameters were set at their all-species average values (Supplemental Table S2).
Figure 7.
Figure 7.
Effects of increasing PPFD incident on the adaxial leaf surface on the difference between maximum and minimum T in the leaf, for each of 14 species (colored lines are named at right; solid lines = hypostomatous species and dashed lines = amphistomatous species), and the median across species (dotted gray line; A) and T at the abaxial leaf surface (median across species; B).
Figure 8.
Figure 8.
Effects of PPFD on the distribution of evaporation (percentage of transpiration rate for the subtended leaf area; A and C) and T (°C) across outside-xylem leaf tissues (B and D) for C. diversifolia. In A and B, PPFD = 0, and in C and D, PPFD = 1,500 μmol m−2 s−1. In A and C, the contours represent evaporation rate from each node in the grid as a percentage of the transpiration rate of the leaf area subtended by that node. Dashed lines in A and C indicate net evaporation of zero (the jagged lines at top left in A indicate a region where net evaporation is nearly uniform at equal to zero, such that the graphing program could not identify a single discrete boundary). The top and bottom of each image represent the adaxial and abaxial leaf surface, respectively, and the left and right sides represent the outer margin and the center of the areole, respectively. See the diagram in Figure 1 for tissue orientation. Tissue-specific percentage contributions to total evaporation rate were as follows (in the order lower epidermis, spongy mesophyll, palisade mesophyll, BS, upper epidermis): at PPFD = 0, 74.3, 6.7, 0, 12.9, and 1.1; at PPFD = 1,500 μmol m−2 s−1, 55.8, 22, 5.3, 15.3, and −3.1.
Figure 9.
Figure 9.
Effects of thermal transport properties on the distribution of evaporation across leaf tissues, with abbreviations as in Figure 2. A, Thermal conductivity of cells as a percentage of the value for pure water. B, Leaf-to-air boundary layer conductance to water vapor. All anatomical parameters were set at their all-species average values (Supplemental Table S2).
Figure 10.
Figure 10.
Changes in the distribution of evaporation across tissues resulting from changes in gs to water vapor. PPFD = 1,500 μmol m−2 s−1, Tair = 25°C, and wair = 15 mmol mol−1. Abbreviations are as in Figure 2. Negative values for evaporation mean that net condensation occurred at the tissue in question. At very low gs, AVT toward the lower epidermis driven by the T gradient between warmer palisade mesophyll and cooler lower epidermis exceeds the net transpirational flow of water out of the lower leaf surface; mass balance requires condensation of the excess water at the lower epidermis and liquid phase flow back up to the mesophyll. All anatomical parameters were set at their all-species average values (Supplemental Table S2).
Figure 11.
Figure 11.
Changes in Kox associated with changes in the distribution of evaporation resulting from variation in environmental parameters. Solid line, Effect of PPFD incident at the adaxial surface; short-dashed line, effect of Tair; dashed-dotted line, effect of wair. All anatomical parameters were set at their all-species average values (Supplemental Table S2).
Figure 12.
Figure 12.
Simulated spatial distribution of relative humidity in the intercellular airspaces, calculated at the T of the lower leaf surface (contours), at PPFD = 0 (A and C) and PPFD = 1,500 μmol m−2 s−1 (B and D) and assuming ψ in the leaf minor veins (ψxylem) of zero (A and B) or −1 MPa (C and D). The contours at which relative humidity = 100%, shown with thick solid lines, represent the origin of the vapor diffusion pathways described by gas-exchange estimates of gs. All anatomical parameters were set at their all-species average values (Supplemental Table S2).
Figure 13.
Figure 13.
The ψ of a tissue varies independently of the evaporation rate from that tissue. When the evaporation rates from the spongy mesophyll (red lines) and lower epidermis (blue lines) were modified by varying PPFD (A) or leaf airspace fraction (B) in the directions indicated by the gray arrows, while holding total evaporation rate constant by adjusting gs, the ψ values of these tissues did not vary in the manner predicted by the hypothesis that an increase in evaporation rate from a tissue should cause its ψ to decline. In A, PPFD was varied between 0 and 1,500 μmol m−2 s−1 while holding all other parameters except gs constant; gs was adjusted between 0.4 and 0.24 mol m−2 s−1 in order to maintain a constant whole-leaf evaporation rate of 4.73 mmol m−2 s−1. In B, the mesophyll airspace fraction was adjusted between 10% and 63% (for spongy mesophyll) and between 6.7% and 40% (for palisade mesophyll) while holding all other parameters except gs constant; gs was adjusted between 0.4 and 0.409 mol m−2 s−1 to maintain whole-leaf evaporation rate constant at 7.07 mmol m−2 s−1. All anatomical parameters were set at their all-species average values (Supplemental Table S2).

Comment in

  • On the Inside.
    Minorsky PV. Minorsky PV. Plant Physiol. 2017 Mar;173(3):1527-1528. doi: 10.1104/pp.17.00218. Plant Physiol. 2017. PMID: 28258119 Free PMC article. No abstract available.

References

    1. Barbour MM, Farquhar GD (2004) Do pathways of water movement and leaf anatomical dimensions allow development of gradients in H218O between veins and the sites of evaporation within leaves? Plant Cell Environ 27: 107–121
    1. Barbour MM, Schurr U, Henry BK, Wong SC, Farquhar GD (2000) Variation in the oxygen isotope ratio of phloem sap sucrose from castor bean: evidence in support of the Péclet effect. Plant Physiol 123: 671–680 - PMC - PubMed
    1. Beerling DJ, Franks PJ (2010) The hidden cost of transpiration. Nature 464: 495–496 - PubMed
    1. Berry JA, Beerling DJ, Franks PJ (2010) Stomata: key players in the earth system, past and present. Curr Opin Plant Biol 13: 233–240 - PubMed
    1. Blizzard WE, Boyer JS (1980) Comparative resistance of the soil and the plant to water transport. Plant Physiol 66: 809–814 - PMC - PubMed

Publication types

MeSH terms