. 2017 Feb 3;355(6324):eaah4701.
doi: 10.1126/science.aah4701.

Coupling organelle inheritance with mitosis to balance growth and differentiation

Affiliations

Coupling organelle inheritance with mitosis to balance growth and differentiation

Amma Asare et al. Science. .

Abstract

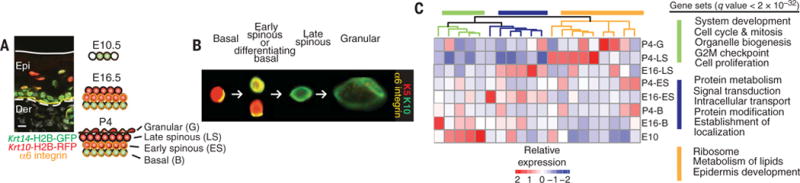
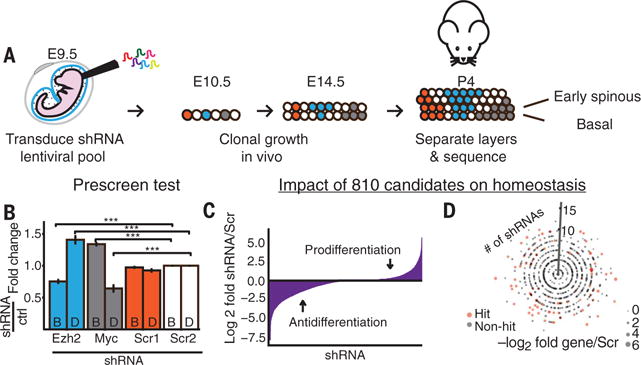
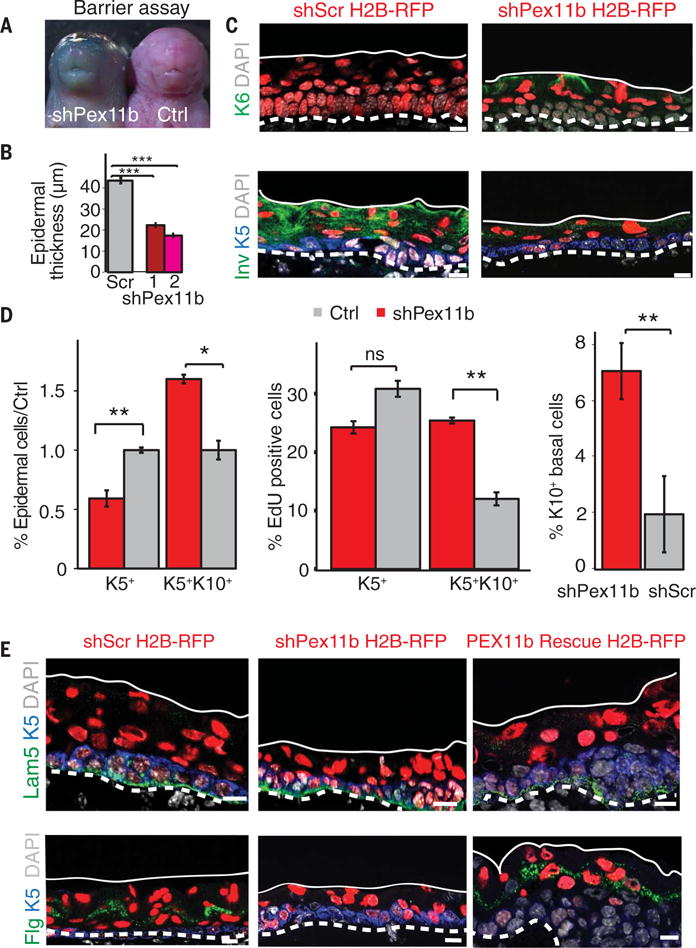
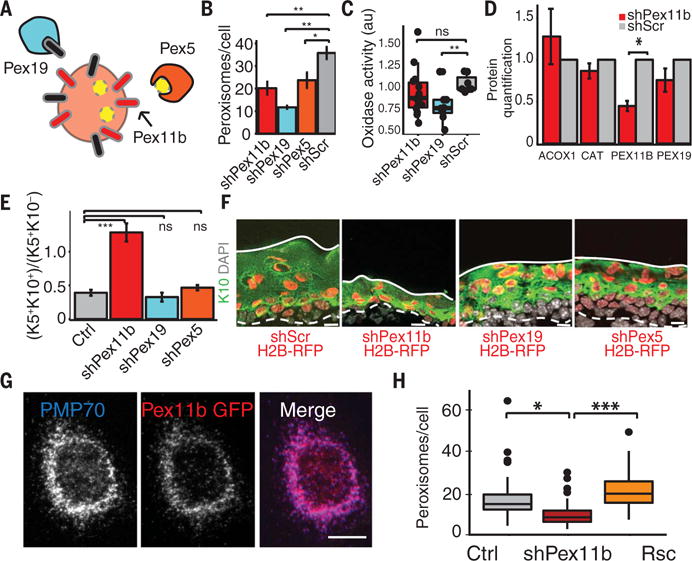
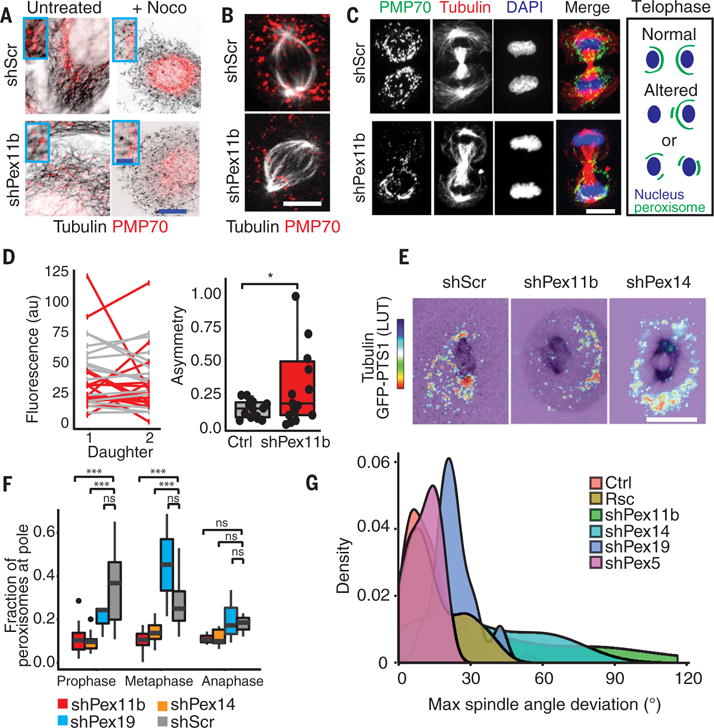
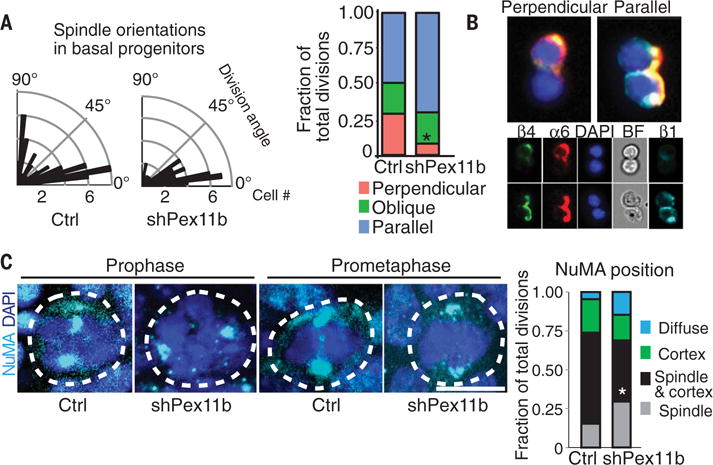
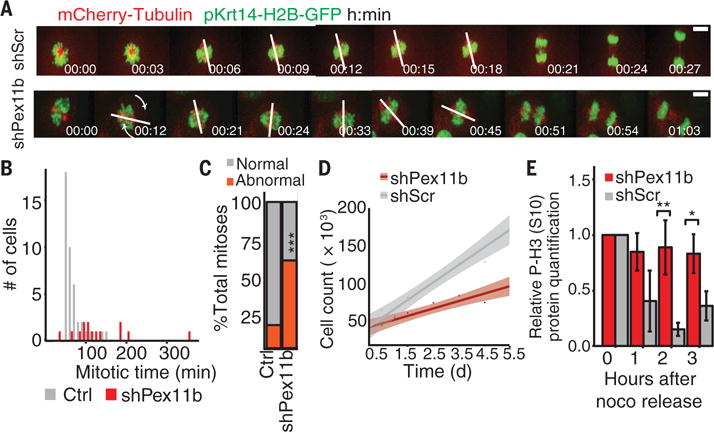
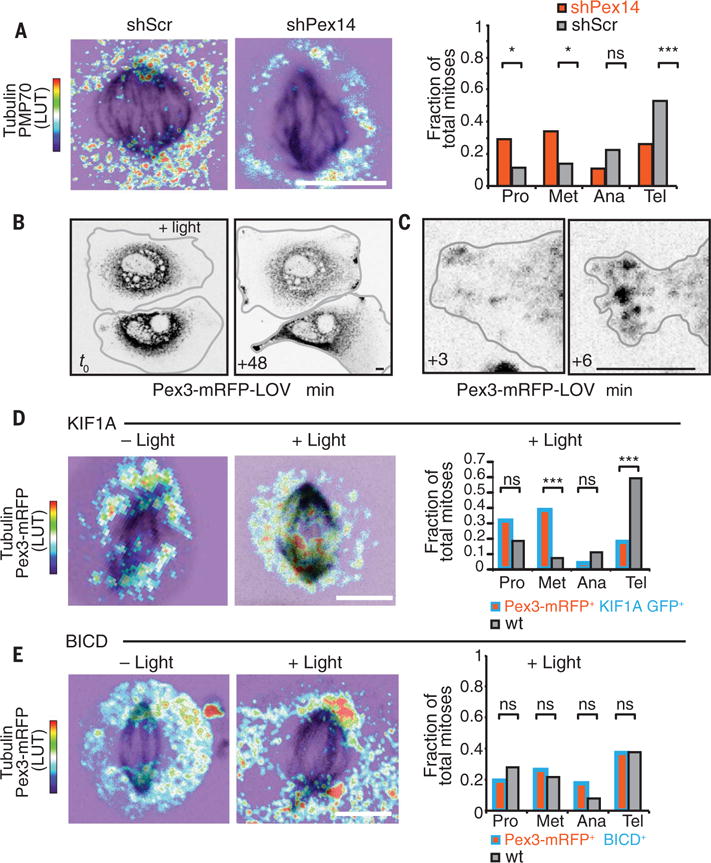
Balancing growth and differentiation is essential to tissue morphogenesis and homeostasis. How imbalances arise in disease states is poorly understood. To address this issue, we identified transcripts differentially expressed in mouse basal epidermal progenitors versus their differentiating progeny and those altered in cancers. We used an in vivo RNA interference screen to unveil candidates that altered the equilibrium between the basal proliferative layer and suprabasal differentiating layers forming the skin barrier. We found that epidermal progenitors deficient in the peroxisome-associated protein Pex11b failed to segregate peroxisomes properly and entered a mitotic delay that perturbed polarized divisions and skewed daughter fates. Together, our findings unveil a role for organelle inheritance in mitosis, spindle alignment, and the choice of daughter progenitors to differentiate or remain stem-like.


Conflict of interest statement

The authors declare no competing financial interests.

Figures

Fig. 1
Fig. 1. Spatiotemporal transcriptional landscape of epidermal differentiation
(A) Differential transgene expression as seen by immunofluorescence in progenitor and differentiated cells of P4 epidermis (Epi). Solid white line denotes skin surface; dashed line denotes the epidermal-dermal border. Der, dermis. Immunostain labels transgene fluorescent fusion proteins driven by promoters for Krt14 (green), Krt10 (red), and α6 integrin residing at the base of epidermal progenitors (yellow). Scheme of epidermal development highlighting the epidermal populations from animals transgenic for Krt14-H2B-GFP and Krt10-H2B-RFP that we isolated across three time points using α6 as an additional marker. Scale bar, 10 μm. (B) ImageStream analysis of P4 epidermal keratinocytes. Arrows indicate progression from undifferentiated to differentiated cells. Progenitors and early differentiated basal cells, identified as basal by their polarized integrin and early differentiating by Krt14 and Krt10 expression; suprabasal early spinous, denoted by loss of polarized integrin with Krt14 and Krt10; late spinous and granular, denoted by Krt10 but distinguishable by size. (C) Temporal and spatial transcriptome patterns of genes differentially expressed during epidermal development. K-means clustering categorized genes into 20 groups of ~200 genes each with similar expression patterns. Genes associated with clustered branches were analyzed for enriched gene sets with GSEA. False discovery rate q values of enrichment were calculated for each gene set.
Fig. 2
Fig. 2. In vivo RNAi screen identifies genes that balance epidermal growth and differentiation
(A) RNAi screen strategy. E9.5 living embryos were transduced in utero with the RNAi lentiviral library. Colors denote examples where an RNAi confers an advantage over control (red) for differentiation (blue) or growth (gray). (B) RNAi-induced shifts in basal/early differentiation (B/D) patterns after in utero knockdown of the established epidermal regulators EZH2 (differentiation inhibitor) and MYC (differentiation promoter). ***P < 0.001, Student’s t test. Error bars show SEM. (C) In vivo screen results showing log2 clone size changes for each shRNA relative to Scrambled control clones for the progenitor→early differentiating progeny step. Screen identifies shRNAs with neutral, prodifferentiation, and antidifferentiation clone size alterations. (D) Impact of 810 cancer and differentiation–associated genes on epidermal homeostasis. Dot plot depicts each gene as a single dot and the number of shRNAs/gene showing a >2 log2 change indicated by the y-axis position. All four screen replicates are aggregated. Genes classified as “hits” are highlighted in pink; the size of the dot indicates the magnitude of fold change relative to shScr controls.
Fig. 3
Fig. 3. A peroxisome-associated protein as an unexpected regulator of epidermal growth and differentiation
(A) Outside-in barrier assay, performed by determining the penetration of blue dye into the skin of the intact mouse pups, shows disrupted epidermal differentiation after loss of PEX11b. The presence of blue dye indicates incomplete barrier formation. The assay was performed on shPex11b (n = 8), control littermate, or shScr (n = 10) embryos at E18.5. (B) Epidermal thinning of back skin of shPex11b embryos at E16.5. Quantifications from two independent shRNAs targeting Pex11b. ***P < 0.001. (C) Alterations of epidermal markers after depletion of PEX11b in E16.5 epidermis. Immunolabeling shows ectopic expression of keratin 6 and loss of involucrin in shPex11b skin. Keratin 5 and 4′,6-diamidino-2-phenylindole (DAPI) were used to mark progenitors and chromatin. (D) Loss of PEX11b perturbs epidermal homeostasis. FACS quantification of differentiation status of shPex11b E16.5 epidermis. **P < 0.01, *P < 0.05, Student’s t test. Quantification of EdU-positive cells by FACS. Embryos were exposed to EdU for 1 to 3 hours before harvest. Note the increase of EdU-labeled K5+K10+ epidermal cells. Quantification of K10+ basal cells from epidermis immunolabeled for keratins 5 and 10. ns, not significant. (E) shPex11b-associated defects are rescued by a Pex11b cDNA refractory to shPex11b. Representative images from E16.5 sagittal sections immunolabeled for laminin 5, filaggrin, and keratin 5 from shScr, shPex11b, and shPex11b + Rescue embryos. Note rescue of epidermal thinning upon cDNA introduction. Scale bars, 10 μm. Dashed white lines mark the basement membrane, and solid white line marks the skin surface.
Fig. 4
Fig. 4. PEX11b balances epidermal growth and differentiation by a mechanism independent of peroxisome function
(A) Scheme of peroxisome protein functions. PEX19 chaperones and imports certain peroxisome membrane proteins; PEX5 recognizes the peroxisomal type 1 targeting sequence for the import of peroxisome proteins; and PEX11b resides in the outer peroxisome membrane and is implicated in peroxisome replication. (B) Loss of Pex5, Pex19, and Pex11b reduces keratinocyte peroxisome numbers. Quantification from 10MKs transduced with shRNAs. (C) shPex11b does not significantly change global oxidase activity levels, a measure of peroxisomal metabolic function. For (B) and (C), **P < 0.01; *P < 0.05. (D) Quantification of immunoblots for peroxisomal proteins shows that shPex11b does not cause a significant reduction of the peroxisomal matrix proteins ACOX1 and CATALASE or the peroxisomal membrane protein PEX19. (E) Pex11b-dependent alterations in epidermal homeostasis. FACS quantification of differentiation status of peroxin-depleted E16.5 epidermis. ***P < 0.001. (F) Images from E16.5 epidermis from peroxisomal knockdown embryos immunolabeled for keratins 5 and 10. (G) PEX11b localizes specifically to peroxisomes. 10MKs were transfected with a cDNA encoding a GFP-Pex11b fusion protein and immunolabeled at interphase for PMP70, a marker of peroxisomes. (H) Pex11b-dependent reductions in peroxisome number are rescued by PEX11b cDNA expression. Peroxisomes per cell per 0.5-μm epidermal Z section were counted for shPex11b, uninfected control, and GFP-Pex11b-Rescue epidermal cells. ***P < 0.001, *P < 0.05, unpaired Student’s t test. Scale bars, 10 μm.
Fig. 5
Fig. 5. Alterations in organelle organization, inheritance, and spindle orientation when peroxisomes cannot localize to spindle poles during mitosis
(A) Peroxisomes reside on microtubules. Interphase shScr and shPex11b keratinocytes immunolabeled for tubulin and PMP70. Images shown are before and after nocodazole treatment to disrupt microtubules. Higher magnifications are shown in insets. Scale bars, 10 μm (main panels); 2.5 μm (insets). (B) Metaphase cells immunolabeled for tubulin and PMP70 show that the spindle pole localization of peroxisomes in shScr cells is lost in shPex11b cells. Scale bar, 10 μm. (C) shPex11b-dependent peroxisome mislocalization and altered inheritance seen in representative images of late-stage mitotic keratinocytes. Cells were immunolabeled for the peroxisomal marker PMP70, tubulin to mark spindles, and DAPI to mark chromatin. Schematic depicts changes in peroxisome positions seen during telophase. Scale bar, 10 μm. (D) Asymmetric peroxisome partitioning after loss of PEX11b. Line plot of PMP70 fluorescence levels in telophase shPex11b (red) and shScr (gray) daughter cells. Note the increased slope of shPex11b pairs indicating unequal amounts of peroxisomes partitioned into daughter cells. (Right) Quantification of asymmetry [(Daughter 1 − Daughter 2)/Total] from telophase pairs. Note increased asymmetry in shPex11b divisions. *P < 0.05, Student’s t test. (E) Spindle pole enrichment of peroxisomes during mitosis. In shScr cells, peroxisomes cluster at spindle poles. This localization is lost after depletion of Pex11b or Pex14. Still images from time-lapse movies of keratinocytes with fluorescent-labeled tubulin and peroxisomal-targeted GFP. Thermal LUT for GFP-PTS1 indicates intensity of fluorescence, with red→blue indicating high→low. Scale bar, 10 μm. (F) Quantification of fraction of total cellular peroxisomes localized at spindle pole regions during early mitosis. In shScr keratinocytes, 35% of all peroxisomes localize to spindle poles in prophase. This association decreases and is lost by anaphase. By contrast, shPex14 and shPex11b keratinocytes fail to associate peroxisomes with spindle poles. ***P < 0.001. (G) Loss of Pex11b and Pex14 results in larger spindle angle movements during mitosis, indicating a defect in the ability to align the spindle. Measurement of size of spindle angle deviations from starting position from time-lapse imaging of mitotic cells. Mathematically smoothed histogram (density plot) of spindle angles quantified from time-lapse imaging of shPex11b and shScr keratinocytes. Note that distribution of shPex11b spindle angles is broader and with a higher maximum than controls. Loss of Pex14 results in large spindle angle movements. P < 0.001, Student’s t test of significance between shScr and shPex11b. shPex11b, n = 18; shScr, n = 34; shPex11b + Rsc, n = 17; shPex5, n = 12; shPex19, n = 10; shPex14, n = 11. Note that alterations arising from shPex11b are rescued by expression of an shRNA-resistant Pex11b cDNA. Note also that loss of Pex5 and Pex19 does not cause alterations in spindle behavior.
Fig. 6
Fig. 6. Failed peroxisome localization to spindle poles leads to failed association of NuMA with the ACD machinery
(A) Radial histograms of division angles of E16.5 basal epidermal progenitors relative to the basement membrane, showing that shPex11b results in a marked decrease in perpendicular divisions. Length of black bars represents the number of mitoses showing particular division angle. Uninfected (Ctrl), n = 50; shPex11b, n = 71. Bar plot of division angle classifications for E16.5 epidermal division angles. Perpendicular divisions = 90° to 65°, oblique divisions = 30° to 65°, parallel divisions = 0° to 30°. *P < 0.05, χ2 test. (B) ImageStream of late-stage mitotic cells distinguishes between perpendicular and parallel epidermal divisions. ImageStream X FACS of isolated keratinocytes from E17.5 epidermis, analyzed for α6 integrin, β4 integrin, β1 integrin, and DAPI. (C) Representative images of early mitotic basal progenitors (white dashed lines) from E17.5 sagittal skin sections. Immunolabeling of mitotic cells is for NuMA (cyan), which is typically associated with spindle poles and also the apical LGN cortical crescent. DNA is shown in blue. Scale bar, 10 μm. Note the selective loss of apical cortical NuMA in the shPex11b cells. Bar plot shows quantification of changes in NuMA position. *P < 0.05.
Fig. 7
Fig. 7. Spindle rotations and mitotic delays after loss of PEX11b
(A) shPex11b-induced uncontrolled spindle rotations with increased mitotic time seen via time-lapse imaging. Spindle angle is shown with a white line and defined as the maximum angle formed between the spindle orientation at the start of video microscopy and the spindle orientation of the particular image taken later during mitosis. Scale bar, 10 μm. (B) Histogram of data from time-lapse imaging of keratinocytes shows slowed mitotic progression (from chromosome condensation to nuclei decondensation) of shPex11b (n = 18) cells relative to shScr (n = 32) control cells. (C) Increased abnormal mitotic outcomes assessed with time-lapse imaging of shPex11b and shScr 10MKs. ***P < 0.001, χ2 test. (D) Delayed keratinocyte expansion in shPex11b cultures after 5.5 days of in vitro growth. (E) shPex11b 10MKs remain in mitosis after cells were treated with nocodazole and then released. Cell lysates were collected hourly for immunoblot analysis of the mitotic marker P-H3(S10). **P < 0.01, *P < 0.05, Student’s t test.
Fig. 8
Fig. 8. Mislocalization of peroxisomes alters mitotic progression
(A) shPex14 keratinocytes uncouple peroxisomes from microtubules, resulting in higher proportions of cells in early mitosis and reduced late mitotic cells relative to shScr cells. Maximal projections of z stack of the entire cell are shown with immunolabeling for tubulin and PMP70. Thermal LUT for PMP70 indicates fluorescence intensity of the peroxisome marker PMP70, with red→blue indicating high→low. ***P < 0.001; *P < 0.05. (B to D) Light-induced ectopic movements of peroxisomes in interphase [(B) and (C)] or in mitotic (D) keratinocytes transfected with Pex3-mRFP-LOVand KIF1A-GFP-ePDZ1b. Time-lapse imaging was for up to an hour [(B) and (D)] or 6 min (C) after light-induced coupling of peroxisomes to the plus-end microtubule motor (KIF1A). Note that even within minutes after photoactivation, peroxisomes move to cortical sites of interphase cells, where the plus ends of microtubules reside. Note that in mitotic cells, plus ends of microtubules reside at the spindle midzone, shifting the localization of peroxisomes. Maximal projections of z stack of the entire cell are shown with immunolabeling for tubulin and fluorescence of Pex3-mRFP-LOV. Thermal LUT for Pex3-mRFP-LOV indicates intensity of fluorescence, with red→blue indicating high→low. Bar plot shows proportions of cells in each part of mitosis. Cells with ectopic association between spindle midzone and peroxisomes have higher proportions of cells in early mitosis and reduced late mitotic cells relative to light-exposed neighbor cells. For (D), ***P < 0.001. (E) Light-induced peroxisome movement to spindle poles via coupling of Pex3-mRFP-LOV and BICD-ePDZ1b, a minus-end microtubule motor segment. Maximal projections of z stack of the entire cell are shown with immunolabeling for tubulin and fluorescence of Pex3-mRFP-LOV. Thermal LUT for Pex3-mRFP-LOV indicates intensity of fluorescence, with red→blue indicating high→low. Cells with enhanced peroxisomes at spindle poles show similar proportions as untransfected controls of cells in each phase of mitosis. Bar plot shows proportions of cells in each part of mitosis. Scale bars, 10 μm (all panels).

Comment in

References

    1. Fuchs E. Finding one’s niche in the skin. Cell Stem Cell. 2009;4:499–502. doi: 10.1016/j.stem.2009.05.001. - DOI - PMC - PubMed
    1. Williams SE, Beronja S, Pasolli HA, Fuchs E. Asymmetric cell divisions promote Notch-dependent epidermal differentiation. Nature. 2011;470:353–358. doi: 10.1038/nature09793. - DOI - PMC - PubMed
    1. Lechler T, Fuchs E. Asymmetric cell divisions promote stratification and differentiation of mammalian skin. Nature. 2005;437:275–280. doi: 10.1038/nature03922. - DOI - PMC - PubMed
    1. Habib SJ, Chen BC, Tsai FC, Anastassiadis K, Meyer T, Betzig E, Nusse R. A localized Wnt signal orients asymmetric stem cell division in vitro. Science. 2013;339:1445–1448. doi: 10.1126/science.1231077. - DOI - PMC - PubMed
    1. Blanpain C, Lowry WE, Pasolli HA, Fuchs E. Canonical notch signaling functions as a commitment switch in the epidermal lineage. Genes Dev. 2006;20:3022–3035. doi: 10.1101/gad.1477606. - DOI - PMC - PubMed

Publication types

MeSH terms