. 2017 Feb 3;355(6324):507-510.
doi: 10.1126/science.aah5982.

Ultrastructural evidence for synaptic scaling across the wake/sleep cycle

Affiliations

Ultrastructural evidence for synaptic scaling across the wake/sleep cycle

Luisa de Vivo et al. Science. .

Abstract

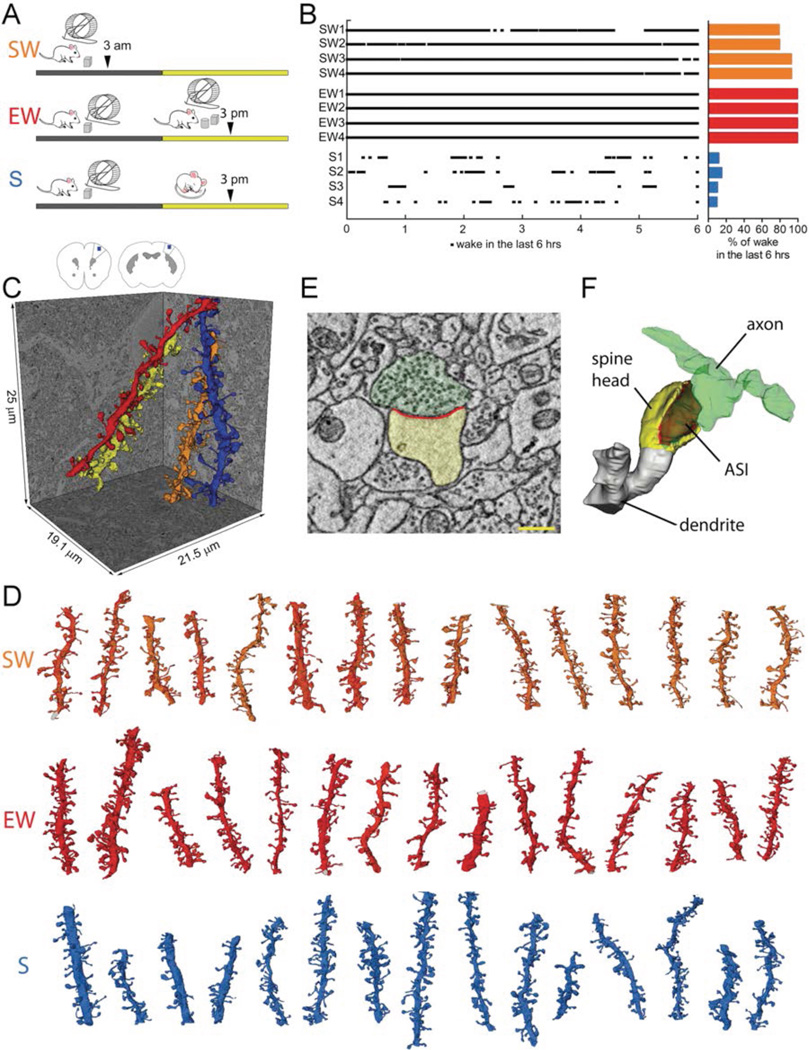
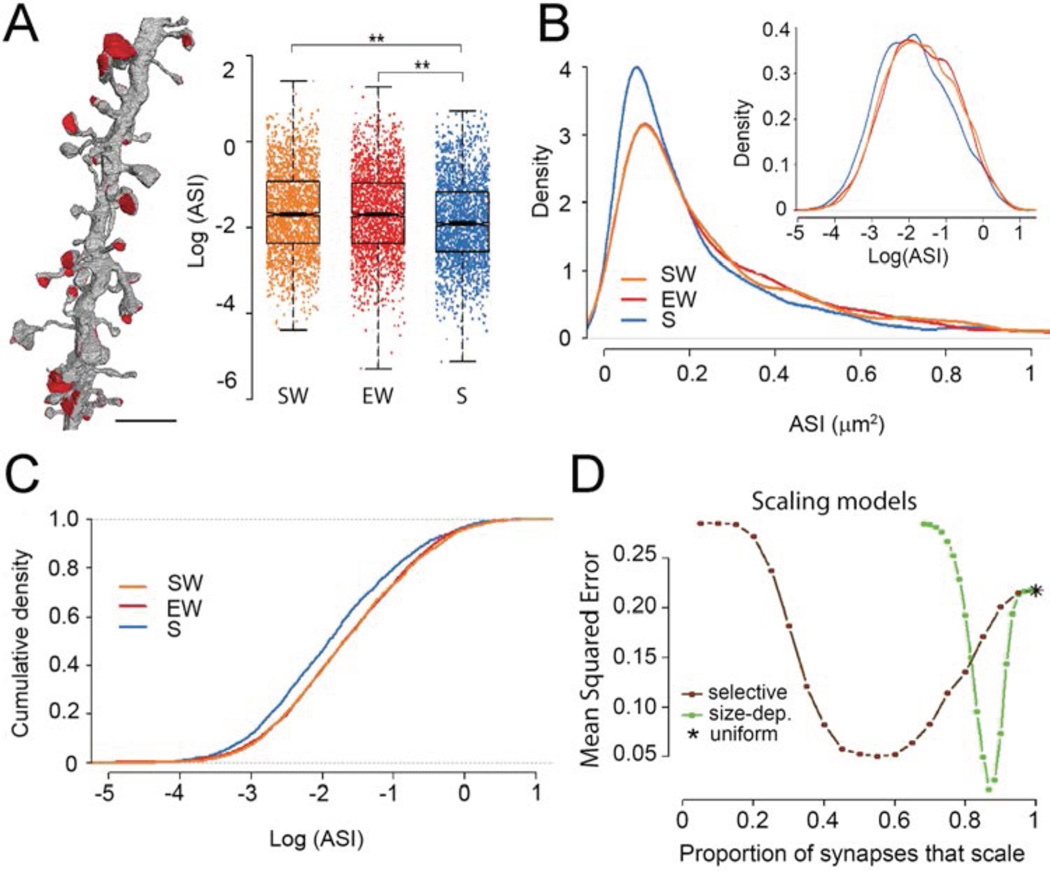
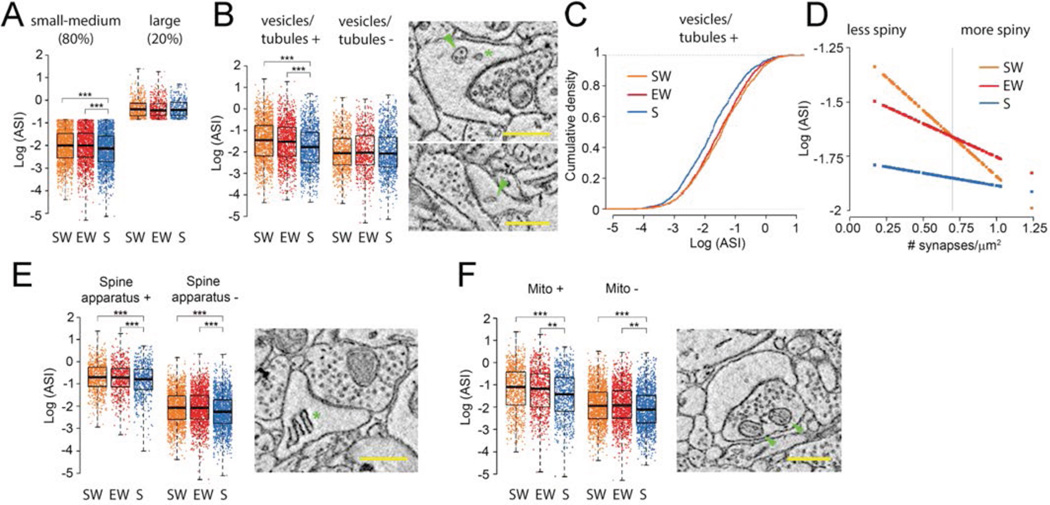
It is assumed that synaptic strengthening and weakening balance throughout learning to avoid runaway potentiation and memory interference. However, energetic and informational considerations suggest that potentiation should occur primarily during wake, when animals learn, and depression should occur during sleep. We measured 6920 synapses in mouse motor and sensory cortices using three-dimensional electron microscopy. The axon-spine interface (ASI) decreased ~18% after sleep compared with wake. This decrease was proportional to ASI size, which is indicative of scaling. Scaling was selective, sparing synapses that were large and lacked recycling endosomes. Similar scaling occurred for spine head volume, suggesting a distinction between weaker, more plastic synapses (~80%) and stronger, more stable synapses. These results support the hypothesis that a core function of sleep is to renormalize overall synaptic strength increased by wake.


Figures

Fig. 1
Fig. 1. Experimental groups and SBEM segmentation of cortical synapses
A, the 3 experimental groups: SW, spontaneous wake at night; EW, wake during the day enforced by exposure to novel objects; S, sleep during the day. Arrowheads indicate time of brain collection. B, percent of wake in each mouse (4 mice/group) during the last 6 hours before brain collection. C, schematic representation of mouse primary motor (M1, left) and somatosensory (S1, right) cortex with the region of SBEM data collection indicated in layer 2 (blue box). Reconstruction of 4 spiny dendritic segments in S1. D, some of the dendritic segments from SW, EW and S mice reconstructed in this study (all segments are shown in Fig.S1). Scale bar = 15 µm. E,F, raw image of a cortical spine containing a synapse and its 3D reconstruction (spine head in yellow, ASI in red; axonal bouton in green). Scale bar = 350 nm.
Fig. 2
Fig. 2. ASI size declines in sleep according to a scaling relationship
A, left, visualization of ASIs in one dendrite. Scale bar = 2.5 µm. Right, effect of condition: ASI size decreases in sleep (blue) relative to both spontaneous wake (orange) and enforced wake (red). ASI size is shown for all synapses, each represented by one dot. **, p< 0.01. B, log-normal distribution of ASI sizes in the 3 experimental groups. Inset, same on a log scale. C, the decrease in ASI size during sleep is due to scaling. D, Monte Carlo simulations comparing different models of scaling: size-dependent selective scaling (green) fits the actual data better than uniform scaling (asterisk) or selective scaling independent of size (brown; see also Methods).
Fig. 3
Fig. 3. Scaling of ASI size is selective
A, the effect of sleep is present in small-medium synapses (80% of all synapses) but not in the largest ones (20% of all synapses); B, the effect of sleep is present in spines with non-SER elements (vesicles, tubules and multivesicular bodies, labeled “vesicles/tubules”); top image shows a multivesicular body (arrowhead) and a coated vesicle (asterisk); bottom image shows a non-SER tubule (arrowhead). C, the ASI decrease during sleep in spines with vesicles/tubules is due to scaling. D, the decline of ASI size in sleep is greatest in the dendrites with the lowest synaptic density (range: 0.17–1.24/µm2); at the average value of synaptic density (vertical line; 0.70/µm2), the mean overall decrease is −17.3% (S vs. SW −17.4%, p = 0.002; S vs. EW −17.3%, p = 0.002). E,F, ASI size declines in sleep independent of the presence of spine apparatus (asterisk) or mitochondria in the axonal bouton (arrowheads). Scale bars = 500 nm. Note that in all experimental groups, spines containing a spine apparatus or facing an axonal bouton with mitochondria are larger than spines lacking these elements. ** p< 0.01; *** p< 0.001.

Comment in

Dataset use reported in

  • Synaptic scaling in sleep.
    Acsády L, Harris KD. Acsády L, et al. Science. 2017 Feb 3;355(6324):457. doi: 10.1126/science.aam7917. Science. 2017. PMID: 28154034 No abstract available.

References

    1. Herculano-Houzel S. The human brain in numbers: a linearly scaled-up primate brain. Front Hum Neurosci. 2009;3:31. - PMC - PubMed
    1. Tang Y, Nyengaard JR, De Groot DM, Gundersen HJ. Total regional and global number of synapses in the human brain neocortex. Synapse. 2001;41:258–273. - PubMed
    1. Holtmaat A, Svoboda K. Experience-dependent structural synaptic plasticity in the mammalian brain. Nat Rev Neurosci. 2009;10:647–658. - PubMed
    1. Nishiyama J, Yasuda R. Biochemical Computation for Spine Structural Plasticity. Neuron. 2015;87:63–75. - PMC - PubMed
    1. Harris KM, Stevens JK. Dendritic spines of CA 1 pyramidal cells in the rat hippocampus: serial electron microscopy with reference to their biophysical characteristics. The Journal of neuroscience : the official journal of the Society for Neuroscience. 1989;9:2982–2997. - PMC - PubMed

Publication types