. 2017 Feb 21;114(8):E1345-E1354.
doi: 10.1073/pnas.1615105114. Epub 2017 Feb 2.

Cdon deficiency causes cardiac remodeling through hyperactivation of WNT/β-catenin signaling

Affiliations

Cdon deficiency causes cardiac remodeling through hyperactivation of WNT/β-catenin signaling

Myong-Ho Jeong et al. Proc Natl Acad Sci U S A. .

Abstract

On pathological stress, Wnt signaling is reactivated and induces genes associated with cardiac remodeling and fibrosis. We have previously shown that a cell surface receptor Cdon (cell-adhesion associated, oncogene regulated) suppresses Wnt signaling to promote neuronal differentiation however its role in heart is unknown. Here, we demonstrate a critical role of Cdon in cardiac function and remodeling. Cdon is expressed and predominantly localized at intercalated disk in both mouse and human hearts. Cdon-deficient mice develop cardiac dysfunction including reduced ejection fraction and ECG abnormalities. Cdon-/- hearts exhibit increased fibrosis and up-regulation of genes associated with cardiac remodeling and fibrosis. Electrical remodeling was demonstrated by up-regulation and mislocalization of the gap junction protein, Connexin 43 (Cx43) in Cdon-/- hearts. In agreement with altered Cx43 expression, functional analysis both using Cdon-/- cardiomyocytes and shRNA-mediated knockdown in rat cardiomyocytes shows aberrant gap junction activities. Analysis of the underlying mechanism reveals that Cdon-/- hearts exhibit hyperactive Wnt signaling as evident by β-catenin accumulation and Axin2 up-regulation. On the other hand, the treatment of rat cardiomyocytes with a Wnt activator TWS119 reduces Cdon levels and aberrant Cx43 activities, similarly to Cdon-deficient cardiomyocytes, suggesting a negative feedback between Cdon and Wnt signaling. Finally, inhibition of Wnt/β-catenin signaling by XAV939, IWP2 or dickkopf (DKK)1 prevented Cdon depletion-induced up-regulation of collagen 1a and Cx43. Taken together, these results demonstrate that Cdon deficiency causes hyperactive Wnt signaling leading to aberrant intercellular coupling and cardiac fibrosis. Cdon exhibits great potential as a target for the treatment of cardiac fibrosis and cardiomyopathy.

Keywords: Cdon; Wnt; cardiac fibrosis; connexin 43; gap junction.


Conflict of interest statement

The authors declare no conflict of interest.

Figures

Fig. 1.
Fig. 1.
Cdon is an ID protein and forms complex with N-cadherin. (A) Immunoblot analysis for Cdon, N-cadherin (N-cad), Connexin 43, (Cx43), Zonula occludens-1 (ZO-1) and α-catenin in 5-mo-old mouse hearts. (B) Representative confocal microscopic images of Cdon and α-actinin staining in mouse (5 mo) and human heart section. (Scale bar, 50 μm.) (C and D) Immunostaining of Cdon with junctional proteins, N-cad, Cx43, and ZO-1 in mouse and human heart section. (Scale bar, 50 µm.) Magnified images indicating colocalization of Cdon and junctional proteins are shown in the white boxes. (Scale bar, 2.5 μm.) Quantificational analysis for colocalization of Cdon and gap junction proteins and Pearson’s correlation coefficients (R) are shown in C and D, Right. Significances of colocalization coefficients were considered as >0.5. (n = 10, 10 and 7 for N-cad, Cx43, and ZO-1, respectively, in mouse or n = 42, 33, and 40 for N-cad, Cx43, and ZO-1, respectively, in human).
Fig. 2.
Fig. 2.
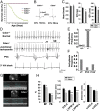
Cdon deficiency causes impaired cardiac function. (A) Survival rate of Cdon+/+, Cdon+/−, and Cdon−/− mouse during postnatal days 1–30. (B and C) Electrocardiogram of 2-wk-old Cdon+/+ and Cdon−/− mice. Note that QT (QTc) was decreased from 38.6 ± 2.1 ms (QTc: 100.8 ± 9.8 ms, n = 8) to 29 ± 2.1 ms (QTc: 79.7 ± 7.1 ms, n = 7, P < 0.05) in Cdon−/− mice, relative to WT. (D) Cdon−/− mice exhibit a wide range of arrhythmias, compared with WT (Top). Shown are records of junctional tachycardia (JT), premature ventricular contraction (PVC), and sustained 3° atrioventricular (AV) block. (E and F) The quantificational analysis for arrhythmia frequency of Cdon+/+ and Cdon−/−. *, P wave. (G and H) Representative examples of the short axis transthoracic M mode echocardiographic tracings in Cdon+/+ and Cdon−/− mice at postnatal day 14. IVS;d: the interventricular septum; diastolic, LVID;d or LVID;s: the internal dimension of left ventricle (LV); diastolic or systolic, LVPW;d or LVPW;s: the postwall thickness of LV; diastolic or systolic. EF, the ejection fraction; FS, the fraction shortening, Significant P values are shown. n = 5. *P < 0.05, *** P < 0.005.
Fig. 3.
Fig. 3.
Increased expression of cardiomyofibrosis and cardiac remodeling genes in neonatal mice lacking Cdon. RNA sequencing analysis with RNAs isolated from Cdon+/+ and Cdon−/− neonatal hearts with biological repeat are shown in AD. (A) Scatterplot images of RNA sequencing. Red and green color indicate up- and down-regulated genes in Cdon−/− hearts, respectively (log twofold change). Black dots indicate genes with no significant change of RNA expression level (less than log twofold change). (B and C) Venn diagram analysis for altered gene expression of Cdon−/− hearts, compared with Cdon+/+ hearts. The percentage of total significance is presented in B, and the graphical analyses of the number of up- and down-regulated genes in Gene Ontology are shown in C. (D) Heat map for RNA expression level of cardiac remodeling genes. (E) Confirmation qPCR analysis for cardiac remodeling genes in D. n = 3. *P < 0.05 and ***P < 0.005. NS, no significance. (F) Histological analysis of the Cdon+/− and the Cdon−/− mouse hearts at P1. Representative images of H&E and Masson’s trichrome staining. [Scale bar, 500 µm (Upper), 100 µm (Lower).] (G) Quantification of fibrotic area in F. n = 3. ***P < 0.005.
Fig. 4.
Fig. 4.
Cdon deficiency causes alterations in Cx43 levels and localization. (A) Immunostaining of Cdon+/+ and Cdon−/− hearts for Cx43 (green) and N-cad (red) as a marker of the ID. (Scale bar, 50 μm.) Boxed areas are enlarged in the Lower panels. (B) Quantificational analysis for Cx43 puncta in A. (n = 6) ***P = 0.005. (C) Representative immunostaining images of isolated Cdon+/+ or Cdon−/− primary cardiomyocytes for Cx43 and N-cad. (Scale bar, 20 μm.) Arrowheads indicate lateralized Cx43. (D) Quantification of lateralized Cx43 in C. n = 85 for Cdon+/+, n = 144 for Cdon−/− cells. ***P < 0.001. (E and F) Western blot analysis for the expression of cardiac intercalated disc proteins in Cdon+/+ and Cdon−/− hearts. HSP90 was used as a loading control. Cdon−/− hearts exhibit twofold increased Cx43 protein level compared with control heart. ***P < 0.005. n = 3. (GJ, Left) Measurement of Lucifer yellow (LY) dye flux in end-to-end (G) or side-to-side cell pairs (I) and subsequent LY dye transfer from a single injected cell to a recipient cell in Cdon+/+ and Cdon−/− cardiomyocytes at 1, 78, and 126 s. Donor cells and recipient cells were marked with a yellow or red line, respectively. Representative regions of interest used to quantify the LY fluorescence are shown in the phase contrast image. (H and J) Representative fitted single time courses of light intensity in recipient cell from cell pairs and summarized τ data of LY transfer in recipient cell from each cell pair shown in G and I, respectively. Note that the time constant (τ, time to reach ∼63% peak) for end-to-end coupling was 158.28 ± 32.70 (n = 7) in WT and 146.6 ± 38.86 (n = 11) in Cdon−/− myocytes (NS). τ for the side-to-side coupling, which was 6,957 ± 997.27 (n = 11) in WT, significantly reduced to 56.60 ± 5.0 in Cdon−/− myocytes (n = 11, ***P < 0.005). [Scale bar (Lower Left) 20 μm.] All experiments in this figure were repeated three times with similar results.
Fig. 5.
Fig. 5.
Increased surface localization of Cx43 and aberrant gap junction activity was induced by Cdon depletion in NRVM cells. (A) Biotinylation of NRVM cells with control or shCdon transfection. (B) Representative confocal images for Cx43 and N-cad in control and shCdon NRVM cells. The quantification of Cx43 sizes and numbers are shown in Middle and Right panels, respectively. *P < 0.05, **P < 0.01. (Scale bar, 10 μm.) (C) Measurement of LY flux for 5 min postinjection in rat cardiac cells transfected with control pSuper, shCdon alone, or shCdon with Cdon. (Scale bar, 20 μm.) Donor cells and recipient cells were marked with yellow (indicated with arrow) or red line, respectively. (D) Quantification of cell numbers for mean dye transfer. Numbers in bars indicate numbers of experiments in each group. *P < 0.05.
Fig. 6.
Fig. 6.
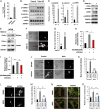
Reciprocal actions of Wnt and Cdon on gap junction activity. (A) Quantification of the nuclear β-catenin accumulation in control (n = 131) and Cdon KD NRVM cells (n = 110). *P < 0.05. (B) Western blot analysis of heart lysate from control and Cdon KO mice at postnatal day 14 for protein expression of Cdon, p-GSK3β, GSK3β, β-catenin, p-LRP6, and LRP6. HSP90 was used as loading control. (C) Quantificational analysis of the relative levels of p-GSK3β/GSK3β, β-catenin, and p-LRP6/LRP6 proteins in B. *P < 0.05, ***P < 0.005. (D) Immunoblot analysis of cell lysates from rat cardiac cells treated with 0.8 μM of TWS119 or the vehicle DMSO for 24 h. The experiments shown in this figure are repeated at least twice with similar results. (E) Immunoblotting of biotinylation of NRVM cells treated with control DMSO or 0.8 μM TWS119. (F) Measurement of LY flux for 5 min postinjection in NRVM cells treated with 0.8 μM TWS119 or vehicle DMSO for 24 h. (Scale bar, 10 μm.) (G) Quantificational data from F. Numbers in bars indicate numbers of experiments in each group. **P < 0.01. (H and I) qPCR analysis for Axin2 and Collagen 1 expression in control or shCdon transfected NRVM cells treated with 4 μM of XAV939 or vehicle DMSO. *P < 0.05, **P < 0.01, ***P < 0.005. n = 3. (J and L) Measurement of LY flux for NRVM cells with the transfection of control or shCdon in combination with the treatment of Wnt inhibitor Dkk1 or control medium (J) and IWP2 or control DMSO (L). (Scale bar, 10 μm.) (K and M) Quantification of cell numbers for mean dye transfer for J and L, respectively. Numbers in bars indicate numbers of experiments in each group. *P < 0.05, **P < 0.01. NS, no significance. (N) Immunostaining of NRVM cells for the localization of Cx43 (green) and N-cadherin (red). (Scale bar, 20 μm.) (O) Quantification data for size of Cx43 puncta from N. **P < 0.01. NS, no significance. n = 15.

Similar articles

Cited by

References

    1. Bui AL, Horwich TB, Fonarow GC. Epidemiology and risk profile of heart failure. Nat Rev Cardiol. 2011;8(1):30–41. - PMC - PubMed
    1. Katz AM. Cardiomyopathy of overload. A major determinant of prognosis in congestive heart failure. N Engl J Med. 1990;322(2):100–110. - PubMed
    1. Mozaffarian D, et al. American Heart Association Statistics Committee and Stroke Statistics Subcommittee Heart disease and stroke statistics--2015 update: A report from the American Heart Association. Circulation. 2015;131(4):e29–e322. - PubMed
    1. Creemers EE, Pinto YM. Molecular mechanisms that control interstitial fibrosis in the pressure-overloaded heart. Cardiovasc Res. 2011;89(2):265–272. - PubMed
    1. Flesch M, et al. Sarcoplasmic reticulum Ca2+ATPase and phospholamban mRNA and protein levels in end-stage heart failure due to ischemic or dilated cardiomyopathy. J Mol Med (Berl) 1996;74(6):321–332. - PubMed

Publication types

MeSH terms

LinkOut - more resources