On the dynamical structure of calcium oscillations
- PMID: 28154146
- PMCID: PMC5321031
- DOI: 10.1073/pnas.1614613114
On the dynamical structure of calcium oscillations
Abstract
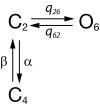
Oscillations in the concentration of free cytosolic Ca2+ are an important and ubiquitous control mechanism in many cell types. It is thus correspondingly important to understand the mechanisms that underlie the control of these oscillations and how their period is determined. We show that Class I Ca2+ oscillations (i.e., oscillations that can occur at a constant concentration of inositol trisphosphate) have a common dynamical structure, irrespective of the oscillation period. This commonality allows the construction of a simple canonical model that incorporates this underlying dynamical behavior. Predictions from the model are tested, and confirmed, in three different cell types, with oscillation periods ranging over an order of magnitude. The model also predicts that Ca2+ oscillation period can be controlled by modulation of the rate of activation by Ca2+ of the inositol trisphosphate receptor. Preliminary experimental evidence consistent with this hypothesis is presented. Our canonical model has a structure similar to, but not identical to, the classic FitzHugh-Nagumo model. The characterization of variables by speed of evolution, as either fast or slow variables, changes over the course of a typical oscillation, leading to a model without globally defined fast and slow variables.
Keywords: cytosolic calcium concentration modeling, multiple time scales; inositol trisphosphate receptor; mathematical modeling.
Conflict of interest statement
The authors declare no conflict of interest.
Figures


Similar articles
-
Dual sensitivity of sarcoplasmic/endoplasmic Ca2+-ATPase to cytosolic and endoplasmic reticulum Ca2+ as a mechanism of modulating cytosolic Ca2+ oscillations.Biochem J. 2004 Oct 15;383(Pt 2):353-60. doi: 10.1042/BJ20040629. Biochem J. 2004. PMID: 15260801 Free PMC article.
-
Stimulus-dependent control of inositol 1,4,5-trisphosphate-induced Ca(2+) oscillation frequency by the endoplasmic reticulum Ca(2+)-ATPase.Biophys J. 2001 Sep;81(3):1398-405. doi: 10.1016/S0006-3495(01)75795-5. Biophys J. 2001. PMID: 11509354 Free PMC article.
-
Modeling the impact of store-operated Ca2+ entry on intracellular Ca2+ oscillations.Math Biosci. 2006 Dec;204(2):232-49. doi: 10.1016/j.mbs.2006.03.001. Epub 2006 Apr 19. Math Biosci. 2006. PMID: 16620876
-
Inositol 1,4,5-trisphosphate receptor subtype-specific regulation of calcium oscillations.Neurochem Res. 2011 Jul;36(7):1175-85. doi: 10.1007/s11064-011-0457-7. Epub 2011 Apr 11. Neurochem Res. 2011. PMID: 21479917 Free PMC article. Review.
-
ITPRs/inositol 1,4,5-trisphosphate receptors in autophagy: From enemy to ally.Autophagy. 2015;11(10):1944-8. doi: 10.1080/15548627.2015.1083666. Autophagy. 2015. PMID: 26291777 Free PMC article. Review.
Cited by
-
Omnitemporal choreographies of all five STIM/Orai and IP3Rs underlie the complexity of mammalian Ca2+ signaling.Cell Rep. 2021 Mar 2;34(9):108760. doi: 10.1016/j.celrep.2021.108760. Cell Rep. 2021. PMID: 33657364 Free PMC article.
-
Differential regulation of ion channels function by proteolysis.Biochim Biophys Acta Mol Cell Res. 2018 Nov;1865(11 Pt B):1698-1706. doi: 10.1016/j.bbamcr.2018.07.004. Epub 2018 Jul 17. Biochim Biophys Acta Mol Cell Res. 2018. PMID: 30009861 Free PMC article. Review.
-
The native ORAI channel trio underlies the diversity of Ca2+ signaling events.Nat Commun. 2020 May 15;11(1):2444. doi: 10.1038/s41467-020-16232-6. Nat Commun. 2020. PMID: 32415068 Free PMC article.
-
Structural titration reveals Ca2+-dependent conformational landscape of the IP3 receptor.Nat Commun. 2023 Oct 28;14(1):6897. doi: 10.1038/s41467-023-42707-3. Nat Commun. 2023. PMID: 37898605 Free PMC article.
-
A neurovascular-unit-on-a-chip for the evaluation of the restorative potential of stem cell therapies for ischaemic stroke.Nat Biomed Eng. 2021 Aug;5(8):847-863. doi: 10.1038/s41551-021-00744-7. Epub 2021 Aug 12. Nat Biomed Eng. 2021. PMID: 34385693 Free PMC article.
References
-
- Berridge MJ, Bootman MD, Roderick HL. Calcium signalling: dynamics, homeostasis and remodelling. Nat Rev Mol Cell Biol. 2003;4(7):517–529. - PubMed
-
- Berridge MJ. Calcium signalling remodelling and disease. Biochem Soc Trans. 2012;40(2):297–309. - PubMed
-
- Dupont G, Falcke M, Kirk V, Sneyd J. Models of Calcium Signalling, Interdisciplinary Applied Mathematics. Vol 43 Springer; Springer International Publishing; Cham, Switzerland: 2016.
-
- Berridge MJ, Lipp P, Bootman MD. The versatility and universality of calcium signalling. Nat Rev Mol Cell Biol. 2000;1(1):11–21. - PubMed
Publication types
MeSH terms
Substances
Grants and funding
LinkOut - more resources
Full Text Sources
Other Literature Sources
Miscellaneous

