. 2017 Mar 15;130(6):1037-1050.
doi: 10.1242/jcs.198853. Epub 2017 Feb 2.

Caveolae provide a specialized membrane environment for respiratory syncytial virus assembly

Affiliations

Caveolae provide a specialized membrane environment for respiratory syncytial virus assembly

Alexander Ludwig et al. J Cell Sci. .

Abstract

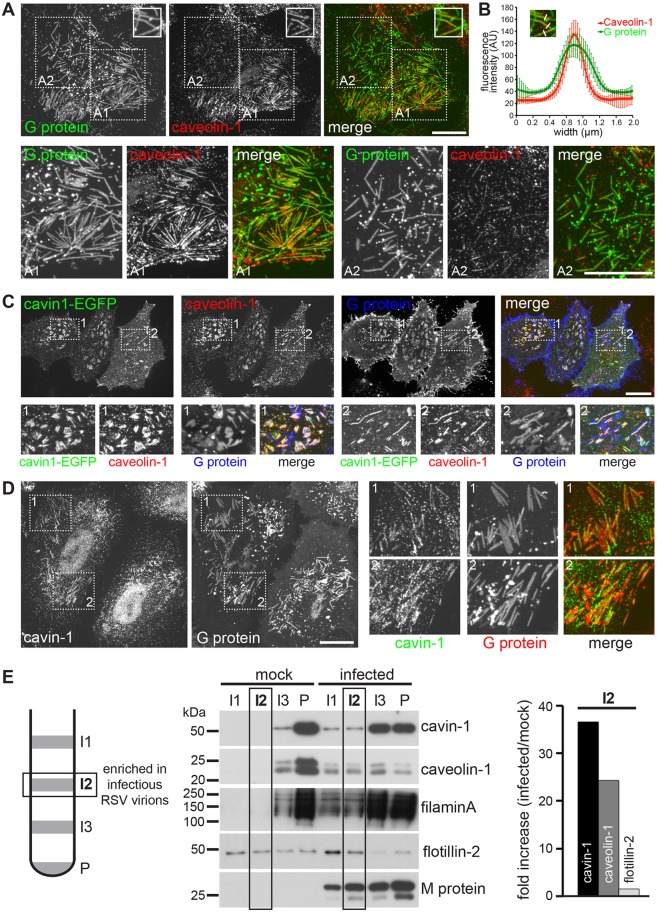
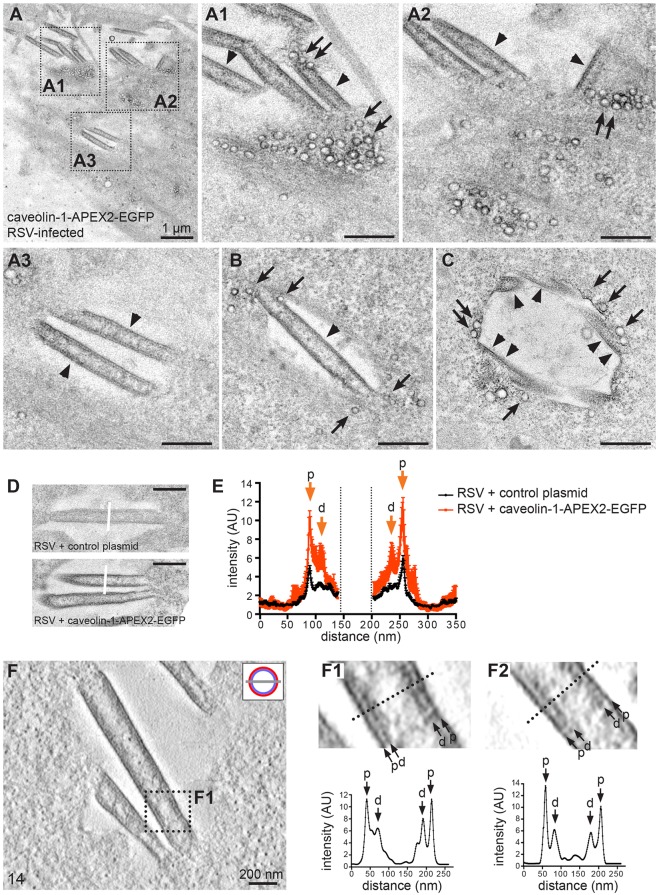
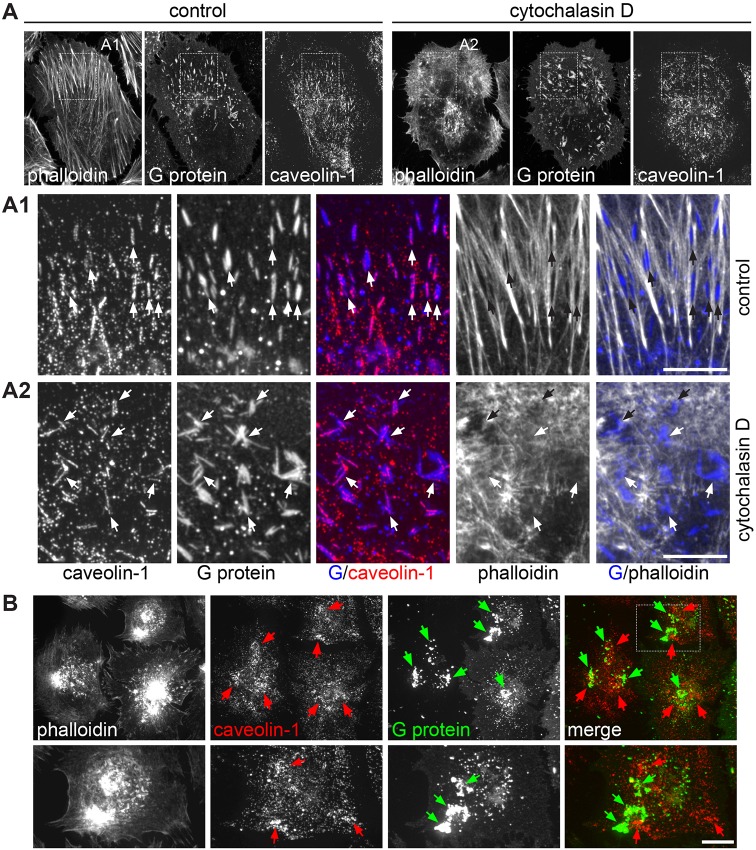
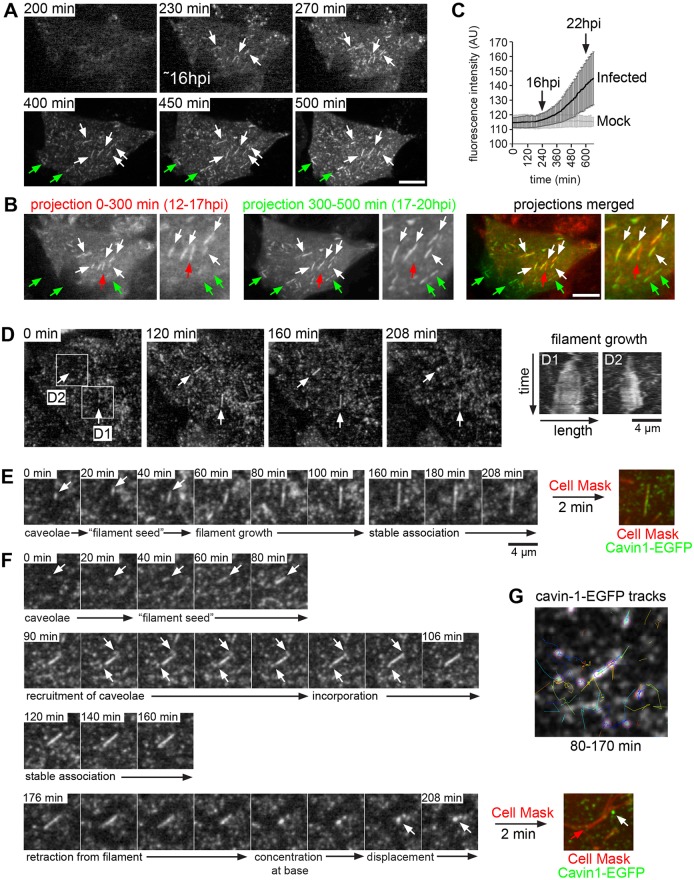
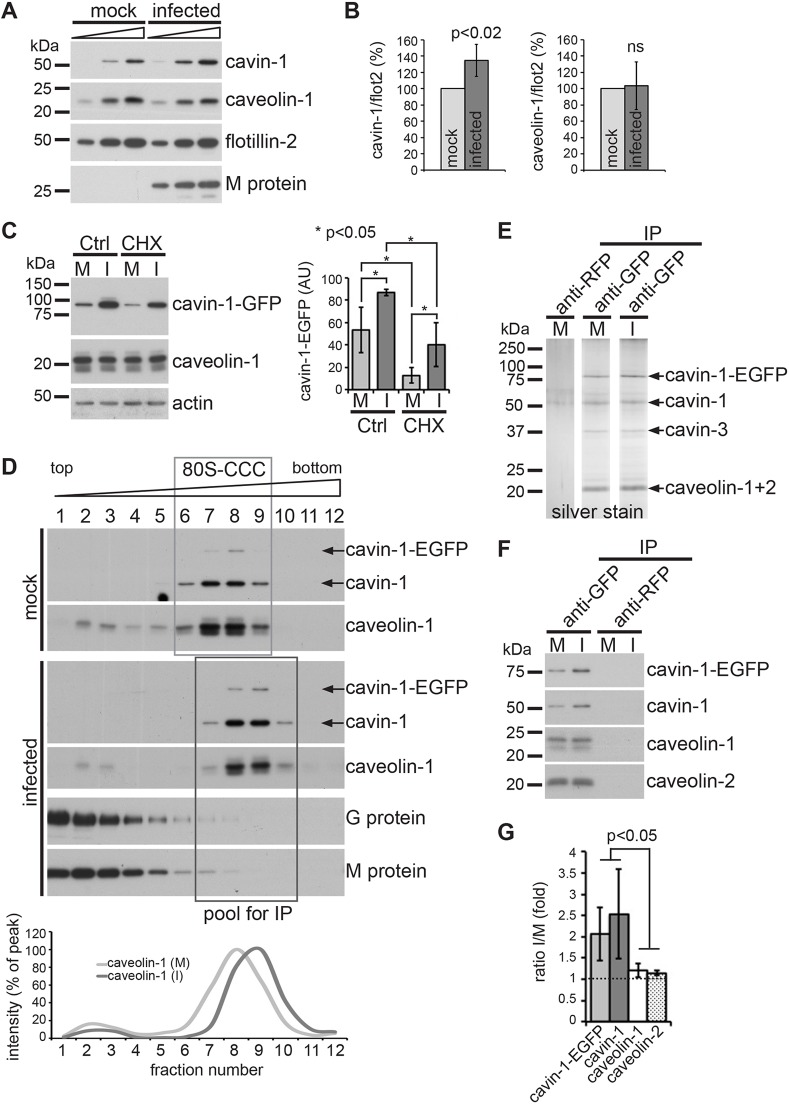
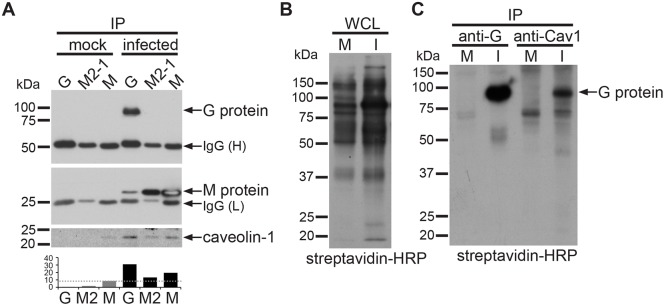
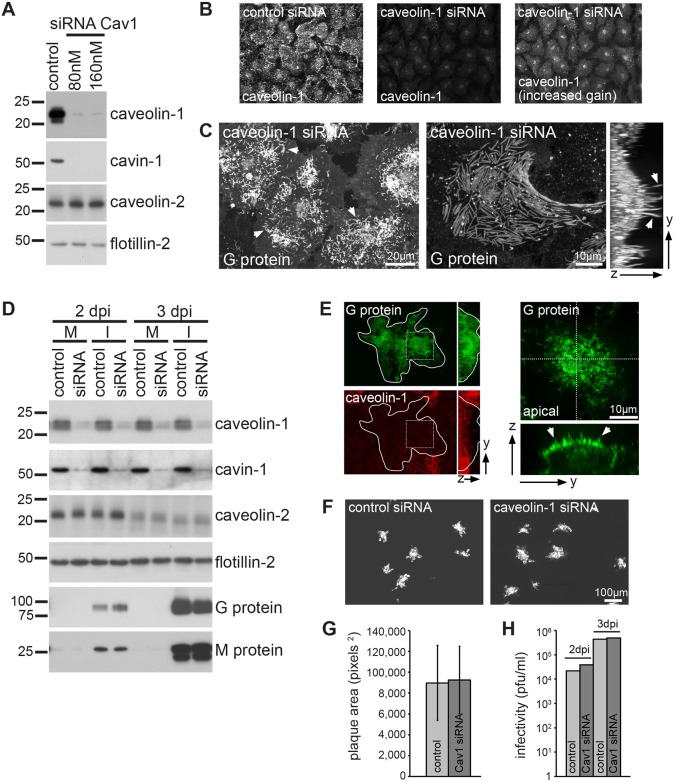
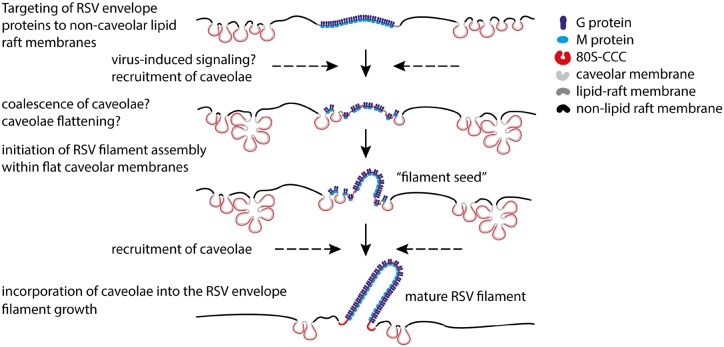
Respiratory syncytial virus (RSV) is an enveloped virus that assembles into filamentous virus particles on the surface of infected cells. Morphogenesis of RSV is dependent upon cholesterol-rich (lipid raft) membrane microdomains, but the specific role of individual raft molecules in RSV assembly is not well defined. Here, we show that RSV morphogenesis occurs within caveolar membranes and that both caveolin-1 and cavin-1 (also known as PTRF), the two major structural and functional components of caveolae, are actively recruited to and incorporated into the RSV envelope. The recruitment of caveolae occurred just prior to the initiation of RSV filament assembly, and was dependent upon an intact actin network as well as a direct physical interaction between caveolin-1 and the viral G protein. Moreover, cavin-1 protein levels were significantly increased in RSV-infected cells, leading to a virus-induced change in the stoichiometry and biophysical properties of the caveolar coat complex. Our data indicate that RSV exploits caveolae for its assembly, and we propose that the incorporation of caveolae into the virus contributes to defining the biological properties of the RSV envelope.

Keywords: Caveolae; Caveolin; Cavin; Respiratory syncytial virus; Virus assembly; Virus envelope.


Conflict of interest statement

Competing interests

The authors declare no competing or financial interests.

Figures

Fig. 1.
Fig. 1.
Caveolin-1 and cavin-1 are associated with RSV filaments. (A) Confocal micrographs of RSV-infected HeLa cells (22 hpi) stained with antibodies against caveolin-1 and RSV G protein. A1 and A2, close-up of boxed regions in A. (B) Average fluorescence intensity distribution of caveolin-1 and G protein in viral filaments (n=10 line scans with a representative image shown in the inset, error bars are standard deviations). (C) Confocal micrographs of RSV-infected HeLa cells (22 hpi) stably transfected with cavin-1–EGFP and co-stained with antibodies against caveolin-1 and RSV G protein. (D) Indirect immunofluorescence and confocal microscopy of RSV-infected HeLa cells (22 hpi) using antibodies against cavin-1 and RSV G protein. (E) Isolation of RSV virions from HEp-2 cells. A schematic of the sucrose gradient is shown. Three interphase fractions (I1–I3) and the pellet (P) were subjected to immunoblotting using the indicated antibodies. The relative enrichment of caveolin-1, cavin-1 and flotillin-2 in I2 was determined by densitometry and plotted (representative of two independent experiments). Scale bars: 20 µm.
Fig. 2.
Fig. 2.
Caveolin-1 is incorporated into the RSV envelope. (A–C) Representative transmission electron micrographs of RSV-infected HeLa cells (22 hpi) transfected with caveolin-1–APEX2–EGFP. (A1–A3) Close-ups of regions boxed in A. Note the electron-dense stain on caveolar membranes (arrows) and the RSV envelope (arrowheads), and the presence of caveolae at the base of virus filaments (A1,A2,B,C). (D) Representative micrographs of control RSV filaments (osmium post-fixation alone, top) and RSV filaments stained with caveolin-1–APEX2–EGFP (bottom). (E) Quantification of staining intensity across the filament width (as indicated in D) in control (black line) and caveolin-1–APEX2–EGFP-stained RSV filaments (red line). Shown are the averages and standard deviations of 22 line scans each (n=6 cells). Note the significant contrast increase in the RSV envelope in caveolin-1–APEX2–EGFP-expressing cells, and the presence of two discrete peaks (p, membrane-proximal; d, membrane-distal). (F) Representative tomographic slice through an RSV filament stained with caveolin-1–APEX2–EGFP. The cartoon depicts the slice position (red, viral envelope; light blue, viral matrix). F1 and F2 are representative close-up views; images were contrast-enhanced and gaussian-filtered. Line scans across the filament are shown. Scale bars are 500 nm unless otherwise stated.
Fig. 3.
Fig. 3.
Caveolin-1 is recruited to RSV filaments in an actin-dependent manner. (A,B) RSV-infected HeLa cells were treated at 14 hpi with 500 nM cytochalasin D (A2,B) or left untreated (A1). Cells were fixed at 20 hpi and stained with antibodies against caveolin-1 and G protein, and phalloidin–FITC. Confocal micrographs are shown. (A1) RSV filaments are aligned along actin fibers. (A2) Partial disruption of the actin network with cytochalasin D causes distortion and aggregation of RSV filaments. Arrows indicate virus filaments (B) RSV-infected and cytochalasin-treated HeLa cells showing complete disruption of the actin cytoskeleton. Note the lack of RSV filaments and the loss of colocalization between caveolin-1 (red arrows) and G protein (green arrows). Representative data of two independent experiments are shown. Scale bars: 10 µm.
Fig. 4.
Fig. 4.
RSV filament assembly occurs within caveolar membranes. (A) HeLa cells stably transfected with cavin-1–EGFP were infected with RSV and imaged live at between 12 and 22 hpi by spinning disk microscopy using a frame rate of 10 min. Still images at the indicated time points are shown; contrast was enhanced for images in the top row. Note the appearance of filamentous structures at 230 min (∼16 hpi). (B) Two average intensity projections (0–300 min and 300–500 min) of the time-lapse shown in A. White arrows indicate RSV filaments that persisted throughout the time-lapse, green arrows indicate de novo formation of filaments between 300 min and 500 min, and red arrows indicate the disappearance of a filament. Scale bars: 10 µm. (C) Quantification of cavin-1–EGFP fluorescence intensity in mock-infected and RSV-infected HeLa cells. Plotted are the mean fluorescence intensities and standard deviations for each time point (n=44 cells each). (D) HeLa cells stably transfected with cavin-1–EGFP were infected with RSV and imaged live at 17 hpi using a frame rate of 2 min. Two regions (D1 and D2) of de novo filament formation are boxed and shown as kymographs on the right, illustrating growth of the two filaments over time. (E,F) Time-lapse gallery of boxed regions in D (E is D1; F is D2). Following the 208 min time-lapse, cells were stained for 2 min with the fluorescent membrane dye CellMask Orange. (G) Automated tracking of cavin-1–EGFP puncta. Note that cavin-1–EGFP puncta are recruited to the filament ends.
Fig. 5.
Fig. 5.
RSV infection alters the stoichiometry of the caveolar coat complex by stabilizing cavin-1 protein. (A) Immunoblotting of whole-cell lysates of mock-infected and RSV-infected HeLa cells (22 hpi) using the indicated antibodies. Increasing amounts (1×, 2×, 3×) of total cell lysates were loaded. (B) Quantification of the data shown in A (n=4; error bars indicate standard deviation) P<0.02; ns, not significant (Student's t-test). (C) HeLa cells stably expressing cavin-1–EGFP were treated at 16 hpi with 100 µg/ml cycloheximide (CHX), or were left untreated (Ctrl), and analyzed by immunoblotting at 22 hpi. Data was quantified by densitometry (n=3; error bars indicate standard deviation). *P<0.05 (Student's t-test). (D) Immunoblots of 10–40% sucrose gradient fractions prepared from mock-infected and RSV-infected HeLa cells stably expressing cavin-1–EGFP. Live cells were crosslinked at 22 hpi with 2 mM DSP. Cells were detergent extracted and the lysate fractionated. The 80S-CCC is boxed. The graph below shows the mean distribution of caveolin-1 in the gradients (n=3 separate experiments). (E) Silver stain gel of the affinity-purified 80S-CCC from mock-infected and RSV-infected cells. Immunoprecipitation was carried out from the boxed gradient fractions shown in D using anti-GFP or anti-RFP antibodies. (F) Immunoblotting of the affinity-purified 80S-CCC using the indicated antibodies. (G) Quantification of the data shown in F (n=3; error bars indicate standard deviation). P<0.05 (Student's t-test). M, mock infected; I, RSV infected.
Fig. 6.
Fig. 6.
Caveolin-1 interacts with the RSV G and M protein complex on the surface of infected cells. (A) Immunoprecipitations of RSV G, M and M2-1 proteins from HeLa whole-cell lysates of mock-infected or RSV-infected cells (22 hpi). Immunoprecipitates were probed for G protein (top panel), M protein (middle panel) and caveolin-1 (bottom panel). Caveolin-1 protein was measured by densitometry (bottom graph). (B) Streptavidin–HRP blot of lysates of surface-biotinylated HeLa cells. M, mock infected; I, RSV infected. (C) Streptavidin–HRP blot of immunoprecipitates from lysates shown in B, using antibodies against RSV G protein or caveolin-1. Representative data of two independent experiments are shown.
Fig. 7.
Fig. 7.
Caveolae are not required for RSV filament morphogenesis. (A) Immunoblots of HeLa cell lysates transfected with caveolin-1 siRNA or control siRNA. Lysates were prepared 4 days post transfection and probed with the indicated antibodies. Shown is a representative of five independent experiments. (B) Confocal micrographs of control and caveolin-1-siRNA-treated HeLa cells stained with antibodies against caveolin-1. (C) Maximum intensity projection (left) and 3D reconstruction of confocal stacks (right) of HeLa cells treated with 80 nM caveolin-1 siRNA for 3 days, infected with RSV (MOI 3) for 22 h, and fixed and stained with anti-G protein antibodies. Note the abundance of RSV filaments (arrowheads). (D) Immunoblots of HEp-2 cell lysates. Cells were transfected with 80 nM caveolin-1 siRNA or control siRNA for 3 days and either infected (I) with RSV (MOI 0.0001) or mock infected (M). Cell lysates were prepared at 2 dpi and 3 dpi, and probed with the indicated antibodies. (E) Representative micrographs of HEp-2 cells transfected with caveolin-1 siRNA and infected with RSV (MOI 0.0001). Cells were fixed 2 dpi and stained with anti-G and anti-caveolin-1 antibodies. The outline of the plaque is shown. Images on the right show the boxed region on the left. Note the presence of RSV filaments on the apical surface of the plaques (arrowheads). (F) Representative fluorescence micrographs of RSV-infected (MOI 0.0001) HEp-2 cells transfected with caveolin-1 siRNA or control siRNA. Cells were fixed 2 dpi and stained with anti-RSV antibody. (G) Quantification of plaque size at 2 dpi. Bar graphs show the mean plaque area, error bars indicate standard deviation (n=132 plaques each). (H) Virus titers determined at 2 dpi and 3 dpi. D–H show representative data from two independent experiments.
Fig. 8.
Fig. 8.
Model of RSV envelope biogenesis. RSV envelope proteins (only the RSV G and M proteins are shown for simplicity) are targeted to non-caveolar lipid raft membranes (Fleming et al., 2006; Brown et al., 2004; McCurdy and Graham, 2003). Caveolae are recruited to such membrane domains just prior to the initiation of RSV filament assembly. Virus-induced changes to the caveolar membrane coat (80S-CCC) and the caveolar lipid profile might induce clustering and coalescence of caveolae at the assembly site and flattening of the caveolar coat. This initiates RSV filament assembly within flat caveolar membranes. Caveolae are subsequently recruited to the growing filament and incorporated into the viral envelope.

Similar articles

Cited by

References

    1. Aloia R. C., Tian H. and Jensen F. C. (1993). Lipid composition and fluidity of the human immunodeficiency virus envelope and host cell plasma membranes. Proc. Natl. Acad. Sci. USA 90, 5181-5185. 10.1073/pnas.90.11.5181 - DOI - PMC - PubMed
    1. Amet T., Ghabril M., Chalasani N., Byrd D., Hu N., Grantham A., Liu Z., Qin X., He J. J. and Yu Q. (2012). CD59 incorporation protects hepatitis C virus against complement-mediated destruction. Hepatology 55, 354-363. 10.1002/hep.24686 - DOI - PMC - PubMed
    1. Ariotti N., Fernández-Rojo M. A., Zhou Y., Hill M. M., Rodkey T. L., Inder K. L., Tanner L. B., Wenk M. R., Hancock J. F. and Parton R. G. (2014). Caveolae regulate the nanoscale organization of the plasma membrane to remotely control Ras signaling. J. Cell Biol. 204, 777-792. 10.1083/jcb.201307055 - DOI - PMC - PubMed
    1. Ariotti N., Rae J., Leneva N., Ferguson C., Loo D., Okano S., Hill M. M., Walser P., Collins B. M. and Parton R. G. (2015). Molecular characterization of caveolin-induced membrane curvature. J. Biol. Chem. 290, 24875-24890. 10.1074/jbc.M115.644336 - DOI - PMC - PubMed
    1. Bachi T. (1988). Direct observation of the budding and fusion of an enveloped virus by video microscopy of viable cells. J. Cell Biol. 107, 1689-1695. 10.1083/jcb.107.5.1689 - DOI - PMC - PubMed

LinkOut - more resources