. 2017 Mar 17;292(11):4446-4456.
doi: 10.1074/jbc.M116.762435. Epub 2017 Jan 30.

A KRAS GTPase K104Q Mutant Retains Downstream Signaling by Offsetting Defects in Regulation

Affiliations

A KRAS GTPase K104Q Mutant Retains Downstream Signaling by Offsetting Defects in Regulation

Guowei Yin et al. J Biol Chem. .

Abstract

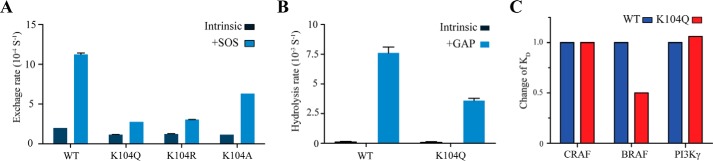
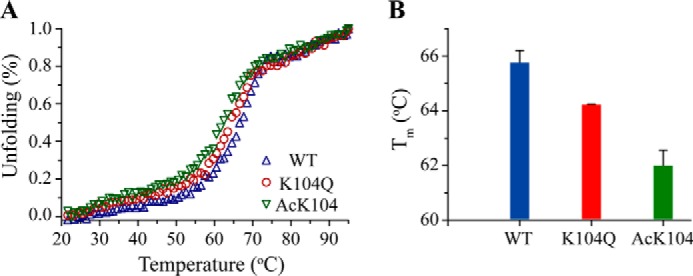
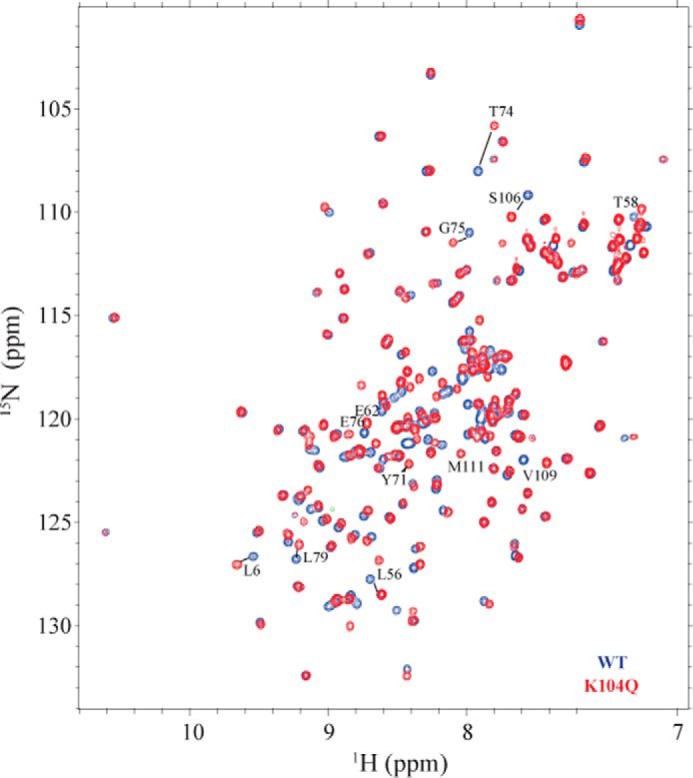
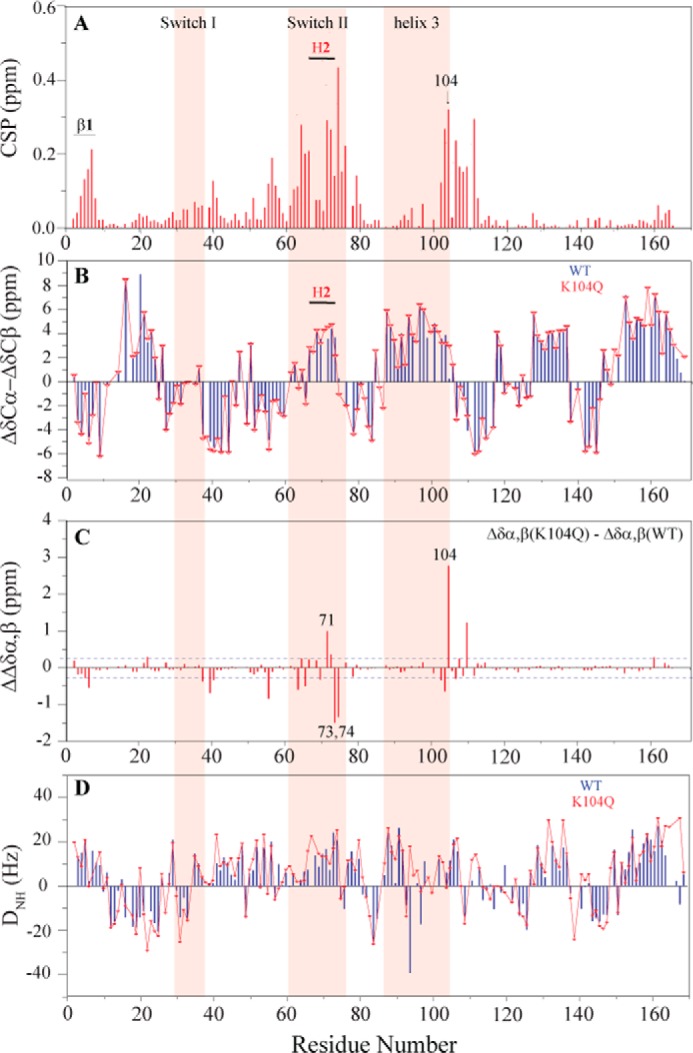
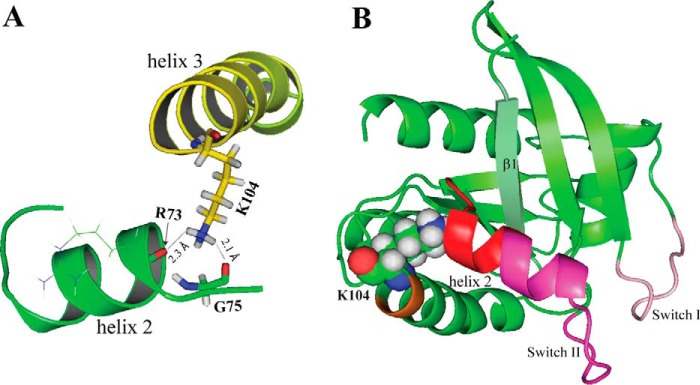
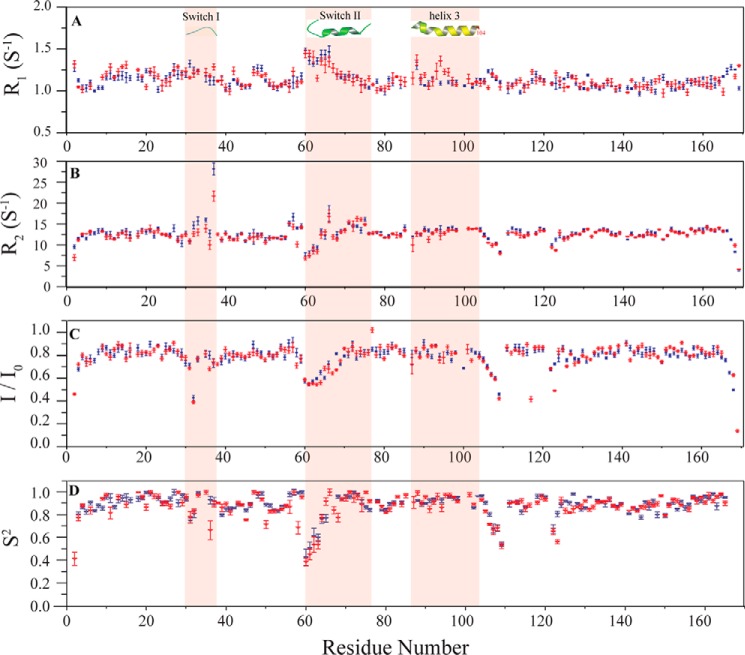
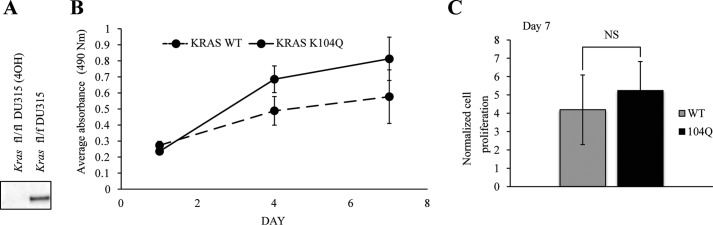
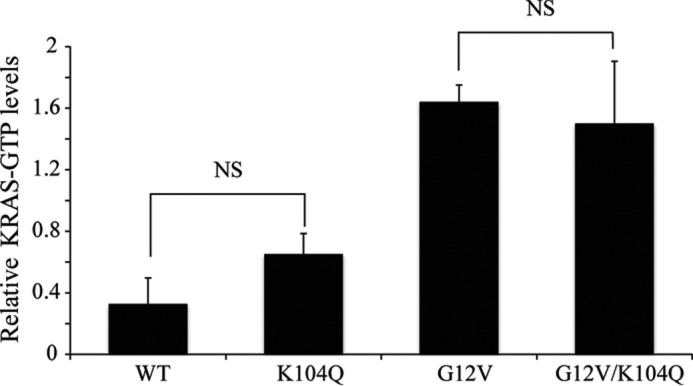
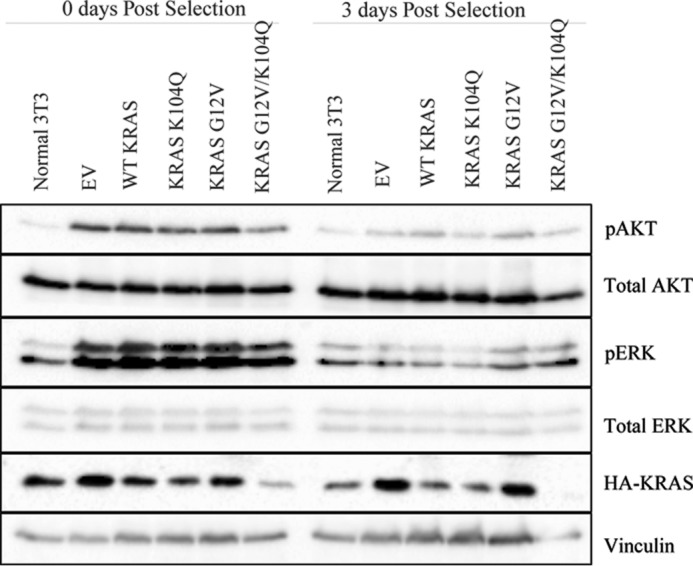
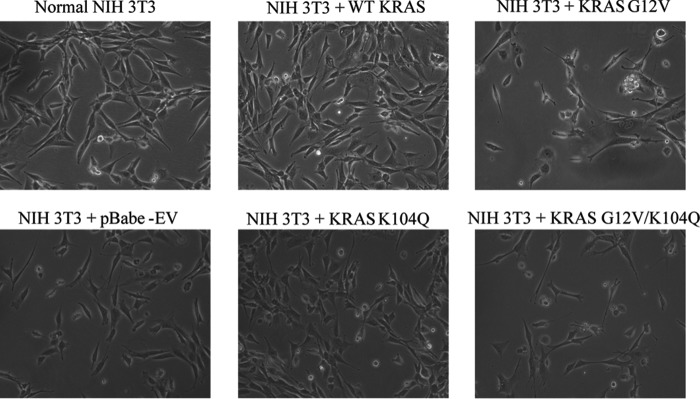
The KRAS GTPase plays a critical role in the control of cellular growth. The activity of KRAS is regulated by guanine nucleotide exchange factors (GEFs), GTPase-activating proteins (GAPs), and also post-translational modification. Lysine 104 in KRAS can be modified by ubiquitylation and acetylation, but the role of this residue in intrinsic KRAS function has not been well characterized. We find that lysine 104 is important for GEF recognition, because mutations at this position impaired GEF-mediated nucleotide exchange. Because the KRAS K104Q mutant has recently been employed as an acetylation mimetic, we conducted a series of studies to evaluate its in vitro and cell-based properties. Herein, we found that KRAS K104Q exhibited defects in both GEF-mediated exchange and GAP-mediated GTP hydrolysis, consistent with NMR-detected structural perturbations in localized regions of KRAS important for recognition of these regulatory proteins. Despite the partial defect in both GEF and GAP regulation, KRAS K104Q did not alter steady-state GTP-bound levels or the ability of the oncogenic KRAS G12V mutant to cause morphologic transformation of NIH 3T3 mouse fibroblasts and of WT KRAS to rescue the growth defect of mouse embryonic fibroblasts deficient in all Ras genes. We conclude that the KRAS K104Q mutant retains both WT and mutant KRAS function, probably due to offsetting defects in recognition of factors that up-regulate (GEF) and down-regulate (GAP) RAS activity.

Keywords: GTPase-activating protein (GAP); Ras protein; guanine nucleotide exchange factor (GEF); nuclear magnetic resonance (NMR); post-translational modification; protein acetylation; signaling; tumorigenesis.


Conflict of interest statement

The authors declare that they have no conflicts of interest with the contents of this article

Figures

FIGURE 1.
FIGURE 1.
The KRAS K104Q mutation impairs regulation by GEFs and GAPs yet retains effector binding interactions with RAF and PI3K RAS binding domains. A, E. coli-expressed and purified WT and mutant (K104Q, K104R, and K104A) were loaded with MANT-GDP, and the rate of GDP dissociation was determined by monitoring the decrease in MANT-GDP fluorescence emission over time in the absence and presence of an SOS (Ras/SOScat = 1:1). Data were fit to an exponential dissociation curve. Rates are reported as the mean ± S.E. (error bars) (n = 2). B, p120 GAPcat-mediated GTP hydrolysis, as determined using single-turnover GTP hydrolysis for KRAS WT and K104Q in the absence or presence of p120 GAP (GAPcat/Ras = 1:200). Hydrolysis was initiated by the addition of Mg2+ and monitored by the change in fluorescence of the protein, Flippi, upon binding free phosphate. Data were converted to phosphate concentration using a standard curve. Results are the mean ± S.E. (n = 2). C, the binding affinity of KRAS WT and K104Q to CRAF RBD, BRAF RBD, and PI3Kγ K802T was determined by loading KRAS proteins with MANT-GMPPCP and measuring nucleotide release rates as a function of effector protein concentration. To determine the affinity (KD) for the KRAS-effector complex, the data were fitted to a standard curve. Relative binding affinity to KRAS WT is shown with original values included in Table 1. Results are reported as the mean ± S.E. (n = 2). All of the original values are listed in Table 1.
FIGURE 2.
FIGURE 2.
Ac-Lys104 and K104Q KRAS show decreased thermal stability relative to WT KRAS. A, the CD signal at 222 nm was monitored as a function of temperature (20–95 °C) for His6-WT KRAS, K104Q, and Ac-Lys104 (20 μm) bound to GDP. B, the midpoint of the thermal transition (Tm) was determined by fitting the temperature dependence in A. Results are reported as the mean ± S.E. (error bars) (n = 3).
FIGURE 3.
FIGURE 3.
2D 1H-15N HSQC NMR spectral overlay of 15N-enriched KRAS K104Q (red) and WT (blue). Residues that show significant chemical shift perturbations (CSP > 0.15) are marked. Spectra were recorded on a Bruker Avance III 700 at 25 °C using 0.7 mm KRAS WT and KRAS K104Q bound to GDP.
FIGURE 4.
FIGURE 4.
K104Q causes structural and dynamic perturbations primarily in helix 2 and helix 3. A, NMR analyses of peak shifts reveal that the K104Q mutation causes large CSPs in switch II and residues 102–110 in helix 3 but minor changes in β1 and switch I. CSP was calculated based on weighted average chemical shift (square root of ((Δσ 1H)2 + (Δσ 15N)2/25)) of WT and K104Q KRAS NH peaks in 1H-15N 2D HSQC NMR spectra. B, differences in secondary structure were determined from Cα and Cβ chemical shift indexing. C, the difference in chemical shift indexing between K104Q and WT KRAS indicates that the KRAS K104Q mutation perturbs the local conformation surrounding 104 in H3 and the later part of the α2 helix (residues 71–74) in switch II. D, NH RDCs were obtained from alignment in Pf1 bacteriophage with deuterium splitting of ∼15 Hz. Switch I, switch II, and H3 are highlighted in pink (ribbon). NMR spectra were recorded at 25 °C on KRAS WT and K104Q (0.7 mm) bound to GDP using a Bruker Avance III 700 NMR spectrometer.
FIGURE 5.
FIGURE 5.
The side chain of Lys104 in helix 3 interacts with helix 2 in switch II. A, expanded region illustrating interactions between H3 and H2, derived from the X-ray structure of KRAS-GDP (PDB 4LPK, resolution 1.5 Å). Hydrogen atoms were added to structure using XLeap (Amber). The Lys104 amino side chain is in close proximity to backbone carbonyl oxygens of Arg73 (H2) and Gly75 in switch II. B, structural perturbations revealed by NMR are mapped on the 3D structure (PDB code 4LPK). Switch I and switch II are colored with pink and purple, respectively. Lys104 is represented by spheres. The perturbed regions, as determined by NMR-derived CSP and chemical indexing, are highlighted in red for the latter part of the H2 and the α2-β4 loop (residues 71–76) and yellow for residues 102–103 in H3.
FIGURE 6.
FIGURE 6.
Backbone 15N relaxation parameters for K104Q KRAS (red) and WT KRAS (blue). Shown from top to bottom, plotted against residue number, are longitudinal relaxation R1 (A), transverse relaxation R2 (B), (1H)-15N steady state heteronuclear NOE (Isaturated/Iunsaturated) (C), and order parameter S2 (D). Switch I, switch II, and H3 are highlighted in pink (ribbon) with secondary structure content represented at the top. Residue 104 at the end of H3 is labeled in red. All measurements were performed on KRAS WT and K104Q bound to GDP. NMR data were collected at 25 °C on 0.2 mm KRAS WT and K104Q samples using a Bruker Avance III 700 NMR spectrometer.
FIGURE 7.
FIGURE 7.
Exogenous KRAS K104Q expression supports the growth of Rasless MEFs. A, the anchorage-dependent growth rate was determined for MEFs deficient for all Ras isoforms with ectopically expressed KRAS WT or K104Q. B, cells were plated, and growth was monitored at days 1, 4, and 7 using the MTT viability assay. Data shown are representative of two independent experiments. Data are the mean ± S.D. (error bars) (n = 48). Student's t test determined that the difference was not significant (NS). C, quantitation of the average ± S.D. of three independent experiments for day 7. Data shown are the average of three independent experiments.
FIGURE 8.
FIGURE 8.
The K104Q mutation does not alter the levels of GTP-bound KRAS. CRAF RBD pull-down analyses were done using cell lysates from NIH 3T3 cells transiently expressing (72 h post-infection) the indicated HA epitope-tagged KRAS WT or mutant proteins. GST-CRAF RBD was used to monitor the level of GTP-bound KRAS protein, with total expression determined by anti-HA blot of total cellular lysates. Data shown are representative of three independent experiments. Quantitation of three experiments done in A (n = 3), with KRAS-GTP levels normalized to total HA-tagged KRAS levels. Error bars, S.E. Student's t test determined that the difference was not significant (NS).
FIGURE 9.
FIGURE 9.
The K104Q mutation does not alter KRAS effector signaling in NIH 3T3 cells. Shown is Western blotting analysis of total cell lysates from mass populations of NIH 3T3 cells transiently infected (72 h) with retrovirus expression vectors encoding the indicated KRAS proteins. Blotting analyses with antibodies for total or phosphorylated and activated AKT and ERK (pAKT and pERK, respectively) were done. Data shown are representative of three independent experiments.
FIGURE 10.
FIGURE 10.
The K104Q mutation does not alter wild type or activated KRAS morphologic transforming activity. Shown is a photomicrograph of mass populations of NIH 3T3 cells transiently (24 h) infected with pBabe-puro retrovirus expression vectors encoding the indicated KRAS proteins.

References

    1. Geyer M., and Wittinghofer A. (1997) GEFs, GAPs, GDIs and effectors: taking a closer (3D) look at the regulation of Ras-related GTP-binding proteins. Curr. Opin. Struct. Biol. 7, 786–792 - PubMed
    1. Vigil D., Cherfils J., Rossman K. L., and Der C. J. (2010) Ras superfamily GEFs and GAPs: validated and tractable targets for cancer therapy? Nat. Rev. Cancer 10, 842–857 - PMC - PubMed
    1. Cox A. D., Fesik S. W., Kimmelman A. C., Luo J., and Der C. J. (2014) Drugging the undruggable RAS: mission possible? Nat. Rev. Drug Discov. 13, 828–851 - PMC - PubMed
    1. Stephen A. G., Esposito D., Bagni R. K., and McCormick F. (2014) Dragging ras back in the ring. Cancer Cell 25, 272–281 - PubMed
    1. Ahearn I. M., Haigis K., Bar-Sagi D., and Philips M. R. (2011) Regulating the regulator: post-translational modification of RAS. Nat. Rev. Mol. Cell Biol. 13, 39–51 - PMC - PubMed

Substances

LinkOut - more resources