. 2017 Mar 10;292(10):4152-4163.
doi: 10.1074/jbc.M117.776146. Epub 2017 Jan 30.

Specific Palmitoyltransferases Associate with and Activate the Epithelial Sodium Channel

Affiliations

Specific Palmitoyltransferases Associate with and Activate the Epithelial Sodium Channel

Anindit Mukherjee et al. J Biol Chem. .

Abstract

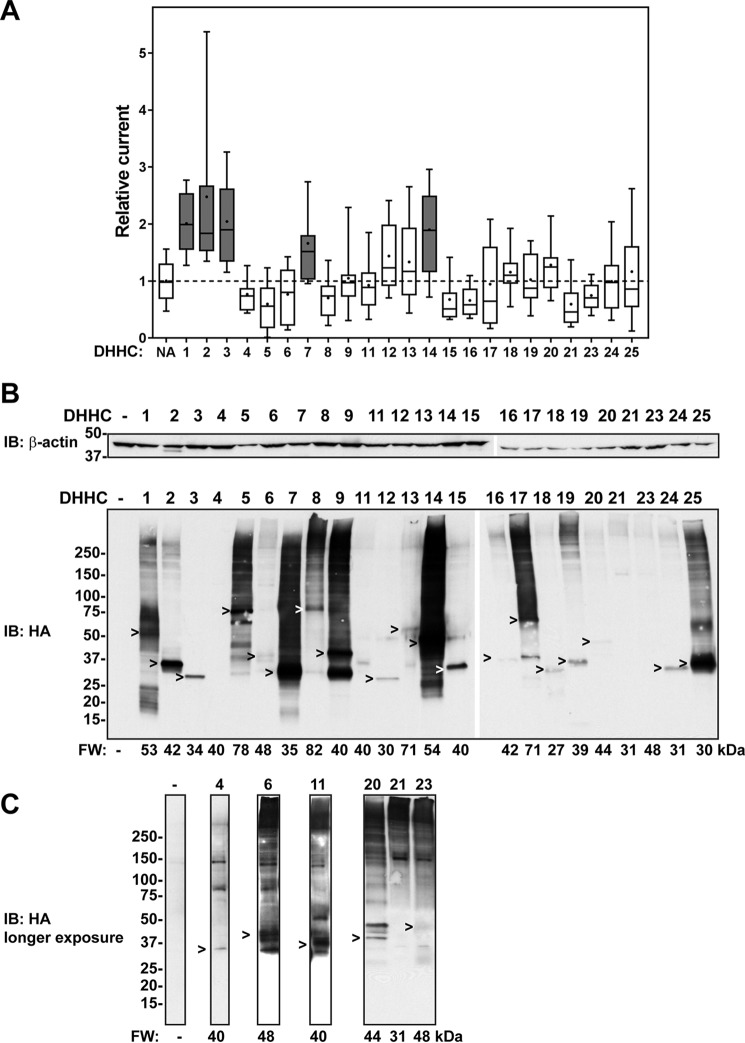
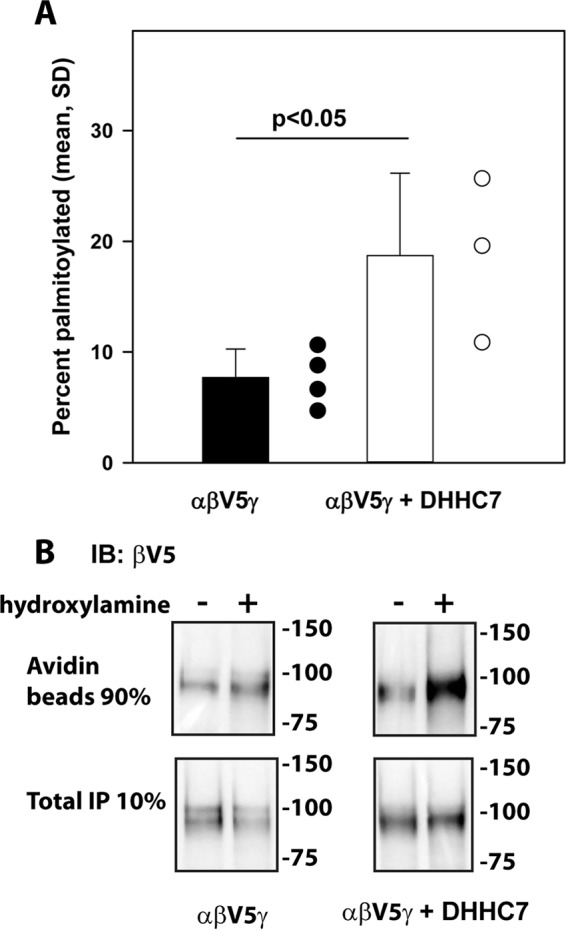
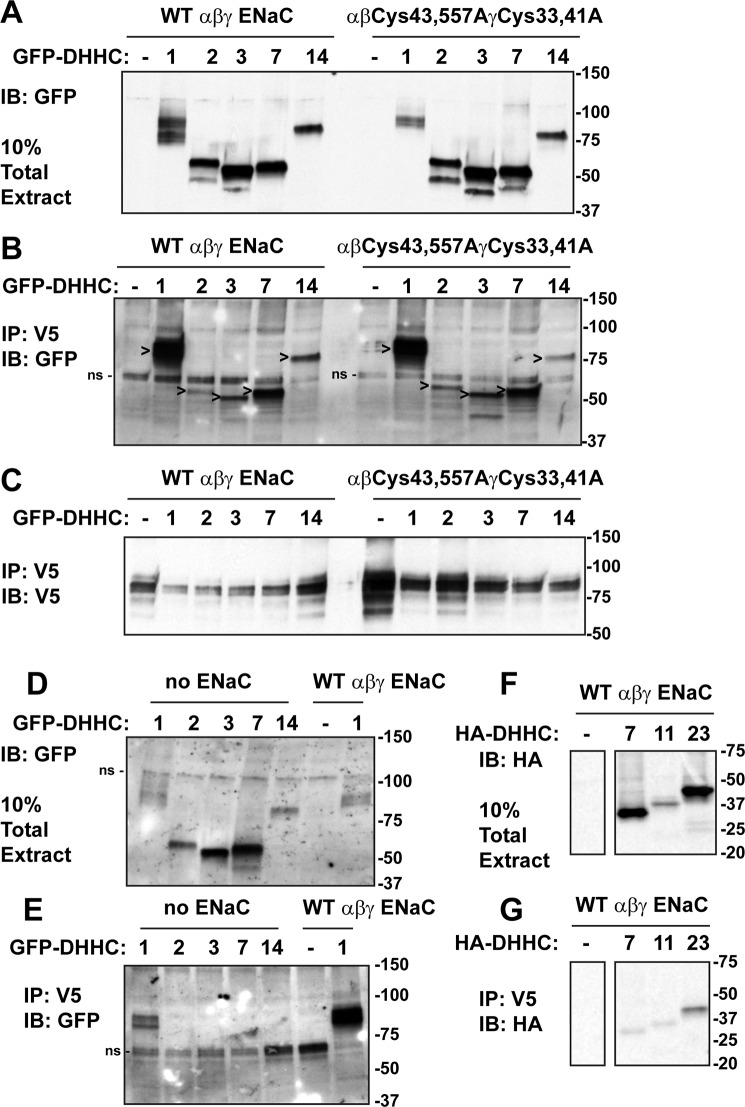
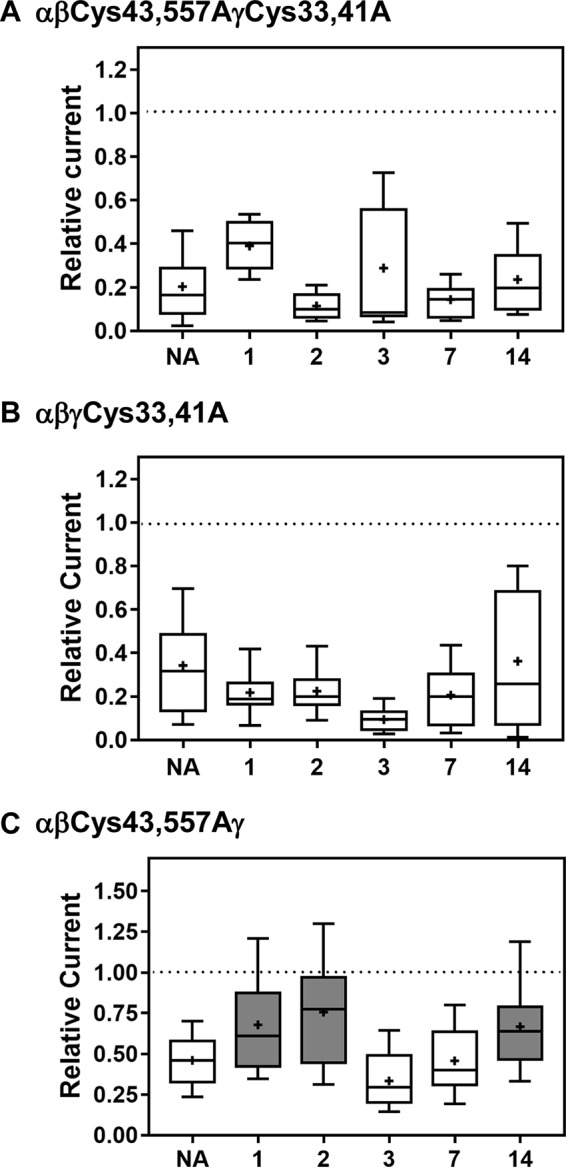
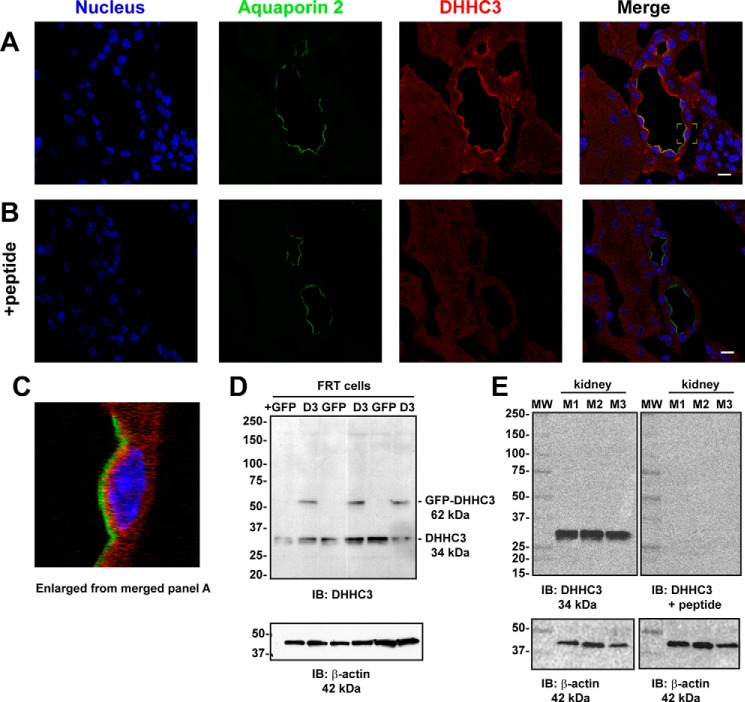
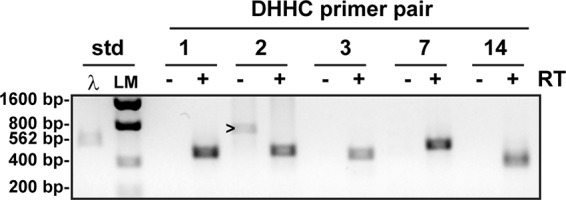
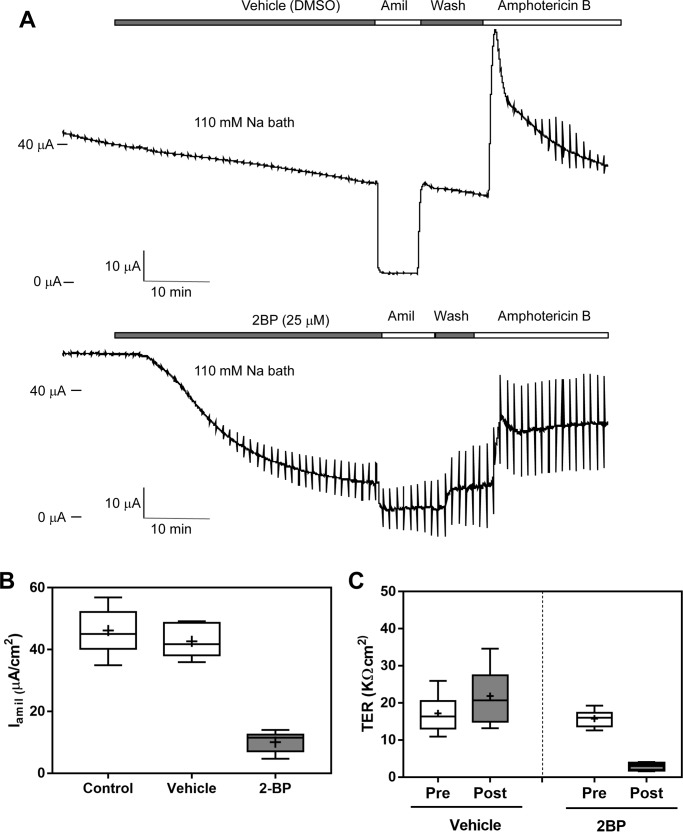
The epithelial sodium channel (ENaC) has an important role in regulating extracellular fluid volume and blood pressure, as well as airway surface liquid volume and mucociliary clearance. ENaC is a trimer of three homologous subunits (α, β, and γ). We previously reported that cytoplasmic residues on the β (βCys-43 and βCys-557) and γ (γCys-33 and γCys-41) subunits are palmitoylated. Mutation of Cys that blocked ENaC palmitoylation also reduced channel open probability. Furthermore, γ subunit palmitoylation had a dominant role over β subunit palmitoylation in regulating ENaC. To determine which palmitoyltransferases (termed DHHCs) regulate the channel, mouse ENaCs were co-expressed in Xenopus oocytes with each of the 23 mouse DHHCs. ENaC activity was significantly increased by DHHCs 1, 2, 3, 7, and 14. ENaC activation by DHHCs was lost when γ subunit palmitoylation sites were mutated, whereas DHHCs 1, 2, and 14 still activated ENaC lacking β subunit palmitoylation sites. β subunit palmitoylation was increased by ENaC co-expression with DHHC 7. Both wild type ENaC and channels lacking β and γ palmitoylation sites co-immunoprecipitated with the five activating DHHCs, suggesting that ENaC forms a complex with multiple DHHCs. RT-PCR revealed that transcripts for the five activating DHHCs were present in cultured mCCDcl1 cells, and DHHC 3 was expressed in aquaporin 2-positive principal cells of mouse aldosterone-sensitive distal nephron where ENaC is localized. Treatment of polarized mCCDcl1 cells with a general inhibitor of palmitoylation reduced ENaC-mediated Na+ currents within minutes. Our results indicate that specific DHHCs have a role in regulating ENaC.

Keywords: Cys palmitoylation; DHHC; epithelial sodium channel (ENaC); ion channel; post-translational modification (PTM); protein acylation; protein palmitoylation.


Conflict of interest statement

The authors declare that they have no conflicts of interest with the contents of this article

Figures

FIGURE 1.
FIGURE 1.
ENaC is activated by specific DHHCs when co-expressed in Xenopus oocytes. A, oocytes were injected with cRNAs for wild type αβγ alone (NA, no addition) or with one of the 23 DHHCs with an N-terminal HA epitope tag as indicated (numbered 1–25). Amiloride-sensitive currents were measured 36–48 h after cRNA injection (n = 11–50) and normalized to currents of wild type αβγ each day. The data are presented as box and whisker plots, with wild type αβγ set as 1 (n = 378, dashed line). Significant increases were found for DHHCs 1, 2, 3, 7, and 14 (gray boxes) (n = 17–24) when compared with αβγ expressed alone (p < 0.01, determined with one-way ANOVA followed by a Tukey test). Whiskers indicate the 10th and 90th percentiles. Median is indicated by a horizontal line, and the mean is indicated with a dot symbol within each box. B and C, oocytes were injected with cRNAs for each of the 23 HA-DHHCs or no DHHC (−), and detergent extracts of oocytes were subjected to SDS-PAGE and immunoblotting with anti-HA antibodies conjugated to HRP or anti-β-actin antibodies (as loading control). A band of the expected size (formula weight in kDa beneath each lane) was observed for all the DHHCs except DHHC 21. A representative immunoblot is shown in B, and a longer exposure is shown in C to enhance the faint signals for DHHCs 4, 6, 11, 20, and 23. The mobility of the Bio-Rad Precision Plus protein standards is shown to the left of each blot.
FIGURE 2.
FIGURE 2.
Palmitoylation of ENaC is increased by co-expression with the activating DHHC 7. HEK293 cells were transfected with αβγ ENaC with a C-terminal V5 epitope tag on the β subunit, with or without the activating DHHC 7 as indicated. Cys palmitoylation of the β subunit in anti-V5 IPs was assessed with fatty acid exchange chemistry where palmitate is removed from Cys with hydroxylamine treatment, using Tris treatment as a negative control, and replaced with biotin. A fraction of the IP (10%) was reserved to assess total β subunit in the initial IP, and biotinylated β subunit was recovered with avidin-conjugated beads (90%) for immunoblotting (IB) with anti-V5 antibodies. The percentage of palmitoylation was calculated from the difference in β subunit biotinylation after treatment with hydroxylamine (+) or Tris (−), relative to the β subunit recovered in the total IP. A, the percentage of β palmitoylation (means and S.D.) in the presence (n = 3, white bar and open circles) or absence (n = 4, black bar and closed circles) of DHHC 7 was statistically significantly different by Student's t test (p < 0.05). B, a representative immunoblot from a single experiment is shown, with the mobility of Bio-Rad Precision Plus protein standards to the right of each panel.
FIGURE 3.
FIGURE 3.
ENaC co-immunoprecipitates with the five activating DHHCs. FRT cells were transfected with WT αβγ ENaC or ENaC with mutant subunits lacking sites for palmitoylation (αβCys43,557AγCys33,41A) either alone (−) or with DHHC 1, 2, 3, 7, or 14 as indicated. All DHHCs had an N-terminal GFP epitope-tag and all three ENaC subunits had a C-terminal V5 epitope tag. A, an aliquot of the cell extract (10% total extract) was retained for immunoblotting (IB) with anti-GFP antibodies. B, the remainder was incubated with anti-V5 antibodies. Total extract and IPs were subjected to immunoblotting with anti-GFP antibodies. C, immunoblots of the IP were stripped and probed with anti-V5 antibodies to assess expression of αβγ ENaC subunits. Mobility of Bio-Rad Precision Plus protein standards is indicated on the right of each blot. The co-immunoprecipitating DHHCs are noted in B with an arrowhead and correspond to the predicted Mr for GFP-tagged DHHC1 (77,978), DHHC2 (66,981), DHHC3 (59,041), DHHC7 (60,213), and DHHC14 (78,658). A nonspecific (ns) band was present in all lanes as indicated in B. The results are representative of three independent experiments. D and E, FRT cells expressing GFP-tagged DHHC 1, 2, 3, 7, and 14 were expressed in the absence of ENaC, whereas ENaC with three V5-tagged subunits was expressed alone (−) or with DHHC 1. Total cell extract (D) and anti-V5 IPs (E) were subjected to immunoblotting with anti-GFP antibodies. Note that the signal for DHHC1 in the IP was greatly enhanced by co-expression of ENaC (E). F and G, ENaC with a V5-tagged α subunit was co-expressed in FRT cells alone (−), with an HA-tagged activating DHHC (DHHC 7), or with an HA-tagged non-activating DHHC (DHHC 11 or 23). Cell extracts (F) and anti-V5 IPs (G) were immunoblotted with anti-HA antibodies conjugated to HRP. The results are representative of three independent experiments.
FIGURE 4.
FIGURE 4.
ENaC-activating DHHCs exhibit β and γ subunit specificity. Xenopus oocytes were injected with cRNAs for wild type αβγ or mutant ENaCs lacking sites for palmitoylation on both subunits (αβCys43,557AγCys33,41A) (A), the γ subunit (αβγC33A,C41A) (B), or the β subunit (αβC43A,C557Aγ) (C). Mutant ENaCs were expressed alone (NA, no addition, n = 77–98) or co-expressed with DHHCs 1, 2, 3, 7, or 14 as indicated (n = 11–33). Amiloride-sensitive currents were measured 48 h after cRNA injection and normalized to wild type αβγ currents each day. The data are presented as box and whisker plots, with wild type αβγ set as 1 (dashed line, n = 73–115). Co-expression of DHHCs with ENaC lacking palmitoylation sites on both the β and γ subunit (A) or just the γ subunit (B) did not affect channel activity (p > 0.05 versus NA). C, co-expression of DHHCs 1, 2, or 14 with ENaC lacking β subunit palmitoylation sites significantly activated the channel (gray boxes) (p < 0.01 for DHHC 1 or 2 versus NA, p < 0.05 for DHHC14 versus NA, determined with one-way ANOVA followed by a Tukey test). Whiskers indicate the 10th and 90th percentiles. The median is indicated by a horizontal line, and the mean is indicated with a cross symbol within each bar.
FIGURE 5.
FIGURE 5.
ENaC-activating DHHC 3 is expressed in mouse kidney ASDN. A, mouse kidneys were fixed in PFA, and cryosections were incubated with goat anti-aquaporin 2 antibodies as a marker of principal cells in the ASDN and rabbit anti-DHHC 3 antibodies, followed by a FITC-tagged anti-goat antibody (green) and a Cy3-tagged anti-rabbit antibody (red). Nuclei were counterstained with TO-PRO 3 (blue). B, preincubation of the anti-DHHC 3 antibody with the antigenic peptide selectively prevented staining (red) without interfering with staining for aquaporin 2 (green). Slides were imaged by confocal microscopy as described under “Experimental Procedures.” The white bar in the merged images is 10 μm. The results are representative of three independent experiments. C, the yellow box in the Merge panel in A is enlarged to emphasize the subapical intracellular staining for DHHC3 in principal cells with apical aquaporin 2 staining. Further validation of the anti-DHHC3 antibody is shown in D and E. D, FRT cells were transfected with either GFP or GFP-DHHC3, and cell extracts were immunoblotted (IB) with anti-DHHC3 antibodies. Bands for the endogenous DHHC 3 (34 kDa) and the transfected GFP-DHHC 3 (62 kDa) are indicated to the right of the panel. E, kidneys from three different mice were homogenized, and duplicate aliquots were immunoblotted with anti-DHHC 3 antibody preincubated with or without the antigenic peptide. D and E, blots were stripped and probed with anti-β-actin antibodies as a loading control. The mobility of the Bio-Rad Precision Plus protein standards is shown to the left of each panel.
FIGURE 6.
FIGURE 6.
Transcripts for ENaC-activating DHHCs are expressed in mCCDcl1 cells. Single-stranded cDNA was generated from total RNA isolated from cultures of mCCDcl1 cells using reverse transcriptase (+ RT) and amplified using PCR with primer pairs specific for mouse DHHC 1, 2, 3, 7, or 14 that span at least one intron. The reactions without RT (−) were analyzed with PCR as a negative control. An aliquot of each PCR was analyzed on a 1% agarose gel as indicated and corresponded to the expected size of the amplified fragments (474 bp for DHHC1, 475 bp for DHHC2, 453 bp for DHHC3, 541 bp for DHHC7, and 420 bp for DHHC 14). A nonspecific band in the − RT lane for DHHC2 is noted by (>) and corresponds to the expected size of a product overlapping an intron. Mobility of lambda (λ) DNA digested with HindIII (562 bp) and low DNA mass ladder markers (LM, 200, 400, 800, and 1600 bp) are indicated on the left of the gel as standards (std, from Invitrogen). The results are representative of three independent experiments.
FIGURE 7.
FIGURE 7.
ENaC activity in mCCDcl1 cells is reduced by an inhibitor of palmitoylation. A, polarized cultures of mCCDcl1 cells growing on permeable supports were placed in a Ussing chamber. Isc was monitored before and for 30 min after apical addition of DMSO (vehicle (1:2,000 dilution), top profile) or 25 μm 2-BP (bottom profile). The ENaC-dependent components of the Isc were determined by the addition of apical amiloride (Amil, 10 μm). After washing out amiloride, the integrity of the epithelium was assessed by apical addition of amphotericin B (120 μg/ml). B, amiloride-sensitive Isc (Iamil) prior to addition of DMSO or 2-BP (control) was compared with that of DMSO-treated (vehicle) and 2-BP-treated cells. The experiment was carried out 5–9 times, and the data are presented as box and whisker plots (gray box, p < 0.001 versus control, by one-way ANOVA). C, TER of pretreated cells of each group (Pre) was compared with that of cells at the end of 30 min treatment (Post) with either DMSO (vehicle) or 2-BP (gray boxes). p < 0.01, one-way ANOVA versus pretreatment control. Whiskers indicate the 10th and 90th percentiles. Median is indicated by a horizontal line, and the mean is indicated with a cross symbol within each box.

Similar articles

Cited by

References

    1. Rossier B. C., and Stutts M. J. (2009) Activation of the epithelial sodium channel (ENaC) by serine proteases. Annu. Rev. Physiol. 71, 361–379 - PubMed
    1. Kashlan O. B., and Kleyman T. R. (2012) Epithelial Na+ channel regulation by cytoplasmic and extracellular factors. Exp. Cell Res. 318, 1011–1019 - PMC - PubMed
    1. Kellenberger S., and Schild L. (2015) International Union of Basic and Clinical Pharmacology: XCI. structure, function, and pharmacology of acid-sensing ion channels and the epithelial Na+ channel. Pharmacol. Rev. 67, 1–35 - PubMed
    1. Canessa C. M., Merillat A. M., and Rossier B. C. (1994) Membrane topology of the epithelial sodium channel in intact cells. Am. J. Physiol. 267, C1682–C1690 - PubMed
    1. Kashlan O. B., and Kleyman T. R. (2011) ENaC structure and function in the wake of a resolved structure of a family member. Am. J. Physiol. Renal Physiol. 301, F684–F696 - PMC - PubMed

Publication types

MeSH terms

LinkOut - more resources