. 2017 Jan 16:14:87-96.
doi: 10.1016/j.nicl.2017.01.007. eCollection 2017.

Connectomic profile and clinical phenotype in newly diagnosed glioma patients

Affiliations

Connectomic profile and clinical phenotype in newly diagnosed glioma patients

Jolanda Derks et al. Neuroimage Clin. .

Abstract

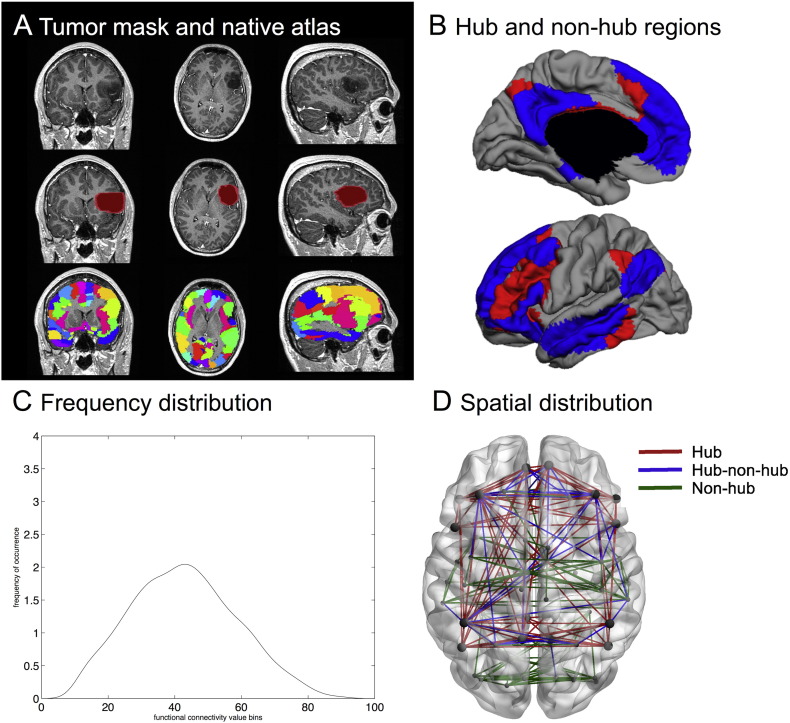
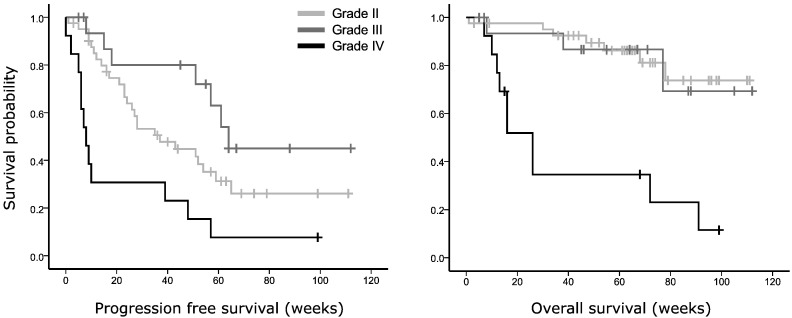
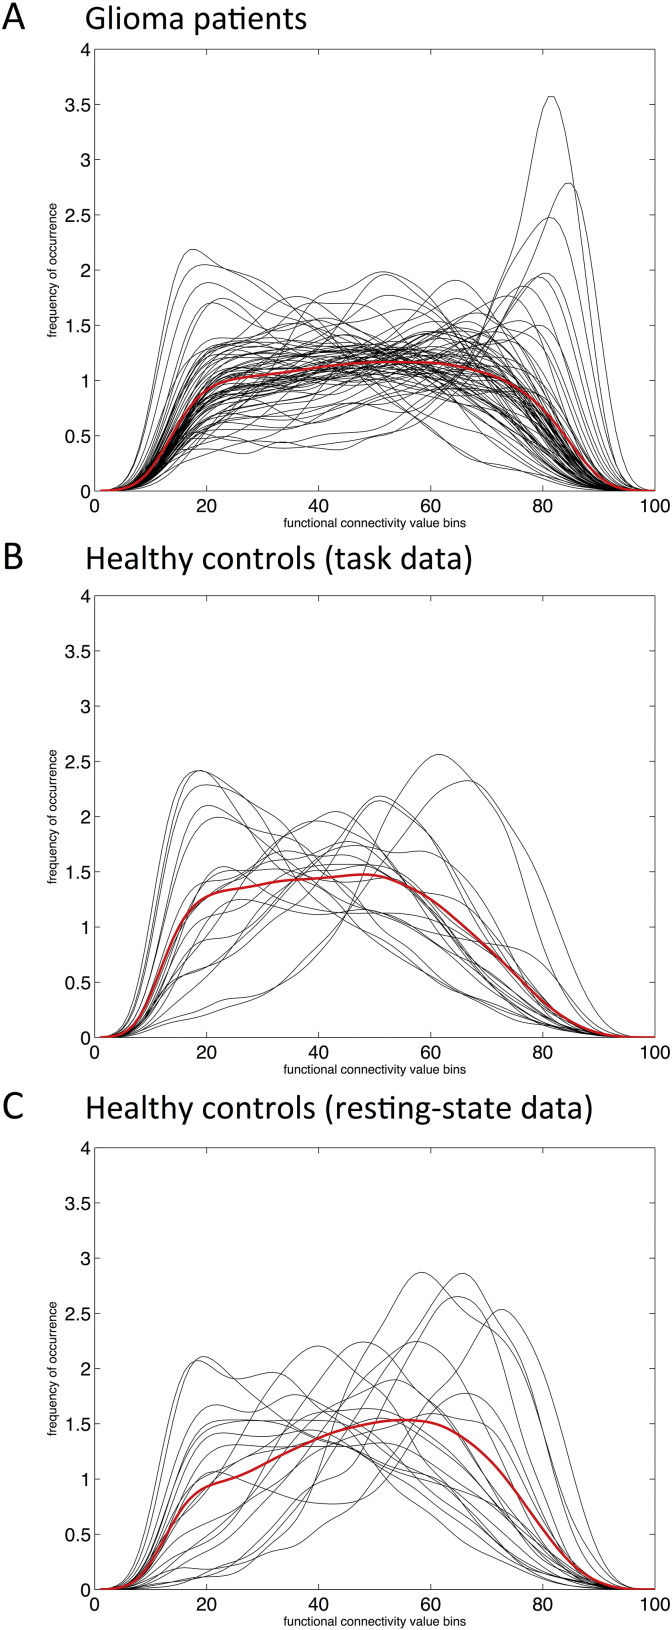
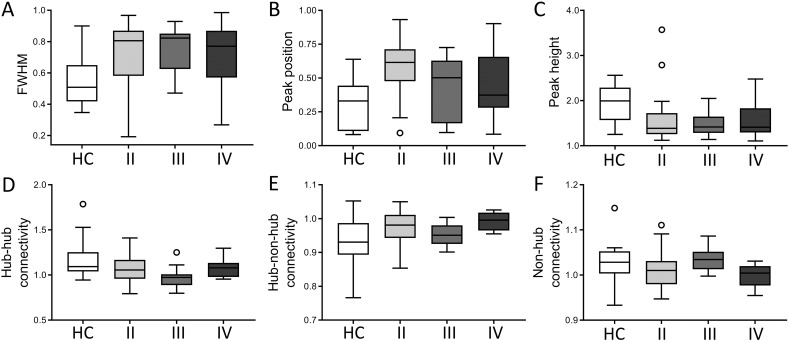
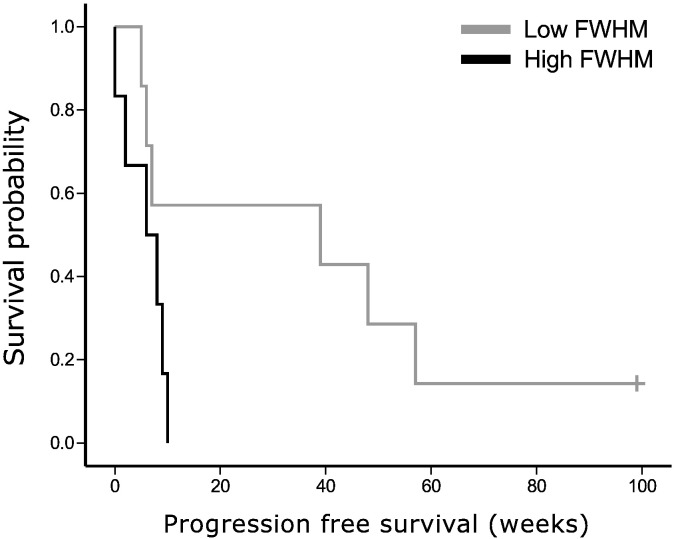
Gliomas are primary brain tumors, originating from the glial cells in the brain. In contrast to the more traditional view of glioma as a localized disease, it is becoming clear that global brain functioning is impacted, even with respect to functional communication between brain regions remote from the tumor itself. However, a thorough investigation of glioma-related functional connectomic profiles is lacking. Therefore, we constructed functional brain networks using functional MR scans of 71 glioma patients and 19 matched healthy controls using the automated anatomical labelling (AAL) atlas and interregional Pearson correlation coefficients. The frequency distributions across connectivity values were calculated to depict overall connectomic profiles and quantitative features of these distributions (full-width half maximum (FWHM), peak position, peak height) were calculated. Next, we investigated the spatial distribution of the connectomic profile. We defined hub locations based on the literature and determined connectivity (1) between hubs, (2) between hubs and non-hubs, and (3) between non-hubs. Results show that patients had broader and flatter connectivity distributions compared to controls. Spatially, glioma patients particularly showed increased connectivity between non-hubs and hubs. Furthermore, connectivity distributions and hub-non-hub connectivity differed within the patient group according to tumor grade, while relating to Karnofsky performance status and progression-free survival. In conclusion, newly diagnosed glioma patients have globally altered functional connectomic profiles, which mainly affect hub connectivity and relate to clinical phenotypes. These findings underscore the promise of using connectomics as a future biomarker in this patient population.

Keywords: Connectome; Functional connectivity; Glioma; Hubs; Network theory; Neuro-oncology.


Figures

Fig. 1
Fig. 1
Visualization of the analysis pipeline. (A) depicts an exemplar patient MR image in the top row (coronal, axial and sagittal views), with the second row containing the lesion mask and the third row indicating the automated anatomical labelling (AAL) atlas regions in native space. In (B), the hub regions, i.e. those areas belonging to the default mode network (DMN, blue) and the frontoparietal network (FPN, red), are displayed on a surface plot. Grey areas are non-hub regions. (C) depicts our first main outcome parameter, namely frequency distribution. This is a smoothed curve depicting connection strength distribution for a single subject, based on the binning of each element in the adjacency matrix. In (D), the second set of outcome parameters is indicated. The connections between hubs (red), between hubs and non-hubs (blue), and between non-hubs (green) were used to obtain three averages in each subject. Hubs are displayed as larger circles while non-hub regions are represented by the smaller circles. (For interpretation of the references to color in this figure legend, the reader is referred to the web version of this article.)
Fig. 2
Fig. 2
Kaplan-Meier survival plots of glioma patients depending on WHO tumor grade. In (A), overall survival is plotted as a function of WHO tumor grade (II, III or IV (GBM), p = 0.004, corrected for Karnofsky performance status (KPS) and tumor volume). (B) Shows progression-free survival per tumor grade (p = 0.007, corrected for KPS and tumor volume).
Fig. 3
Fig. 3
Smoothed connectivity profiles for glioma patients and healthy controls. In all panels, smoothed frequencies of occurrence according to subjects' individual connectivity values (y-axes) were determined for 100 equally spaced bins (x-axes), and depicted in black. Averaged distributions over the entire group are shown in red. (A) Depicts the frequency distribution (FD) of functional connectivity for glioma patients during task-state fMRI (n = 71). In (B), the FD of the healthy controls using task-state fMRI is shown. In (C), the FD of the resting-state data of the same healthy controls is depicted. (For interpretation of the references to color in this figure legend, the reader is referred to the web version of this article.)
Fig. 4
Fig. 4
Connectivity profiles per subgroup. This figure depicts boxplots for all connectivity profiles of healthy controls (HC), as well as glioma patients specified according to WHO tumor grade (II, III, and IV). In the top row, the whole-brain measures based on the frequency distribution ((A) full-width half maximum (FWHM), (B) peak position and (C) peak height) are indicated. In the bottom row, average normalized connectivity (D) between hubs, (E) between hubs and non-hubs, and (F) between non-hubs is shown.
Fig. 5
Fig. 5
Progression-free survival relates to connectivity profile in grade IV glioma. Full-width half maximum (FWHM), based on the frequency distribution, was dichotomized using a median split in order to draw this Kaplan-Meier plot of progression-free survival (PFS) in grade IV glioma patients (p = 0.042, while correcting for Karnofsky performance status and tumor volume).

References

    1. Aerts H., Fias W., Caeyenberghs K., Marinazzo D. Brain networks under attack: robustness properties and the impact of lesions. Brain. 2016 - PubMed
    1. Aertsen A.M., Gerstein G.L., Habib M.K., Palm G. Dynamics of neuronal firing correlation: modulation of “effective connectivity”. J. Neurophysiol. 1989;61:900–917. - PubMed
    1. Anticevic A., Cole M.W., Murray J.D., Corlett P.R., Wang X.-J., Krystal J.H. The role of default network deactivation in cognition and disease. Trends Cogn. Sci. 2012;16:584–592. - PMC - PubMed
    1. Bartolomei F., Bosma I., Klein M., Baayen J.C., Reijneveld J.C., Postma T.J., Heimans J.J., van Dijk B.W., de Munck J.C., de Jongh A., Cover K.S., Stam C.J. Disturbed functional connectivity in brain tumour patients: evaluation by graph analysis of synchronization matrices. Clin. Neurophysiol. 2006;117:2039–2049. - PubMed
    1. Bartolomei F., Bosma I., Klein M., Baayen J.C., Reijneveld J.C., Postma T.J., Heimans J.J., van Dijk B.W., de Munck J.C., de Jongh A., Cover K.S., Stam C.J. How do brain tumors alter functional connectivity? A magnetoencephalography study. Ann. Neurol. 2006;59:128–138. - PubMed