

Value of tumor stiffness measured with MR elastography for assessment of response of hepatocellular carcinoma to locoregional therapy
- PMID: 28154910
- PMCID: PMC5590631
- DOI: 10.1007/s00261-017-1066-y
Value of tumor stiffness measured with MR elastography for assessment of response of hepatocellular carcinoma to locoregional therapy
Abstract
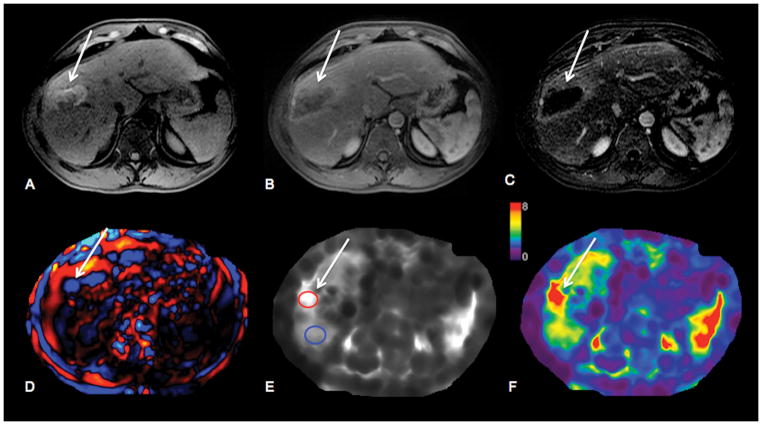
Purpose: The aim of the study was to correlate tumor stiffness (TS) measured with MR elastography (MRE) with degree of tumor enhancement and necrosis on contrast-enhanced T1-weighted imaging (CE-T1WI) in hepatocellular carcinomas (HCC) treated with Yttrium-90 radioembolization (RE) or transarterial chemoembolization plus radiofrequency ablation (TACE/RFA).
Material and methods: This retrospective study was IRB-approved and the requirement for informed consent was waived. 52 patients (M/F 38/14, mean age 67 years) with HCC who underwent RE (n = 22) or TACE/RFA (n = 30) and 11 controls (M/F 6/5, mean age 64 years) with newly diagnosed untreated HCC were included. The MRI protocol included a 2D MRE sequence. TS and LS (liver stiffness) were measured on stiffness maps. Degree of tumor necrosis was assessed on subtraction images by two observers, and tumor enhancement ratios (ER) were calculated on CE-T1WI by one observer.
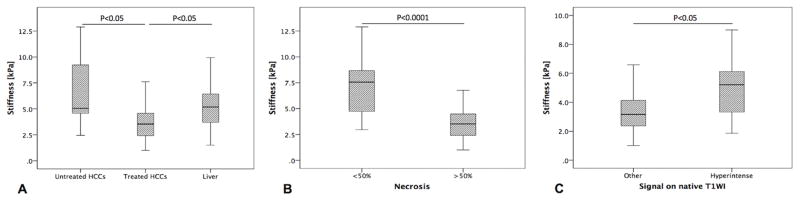
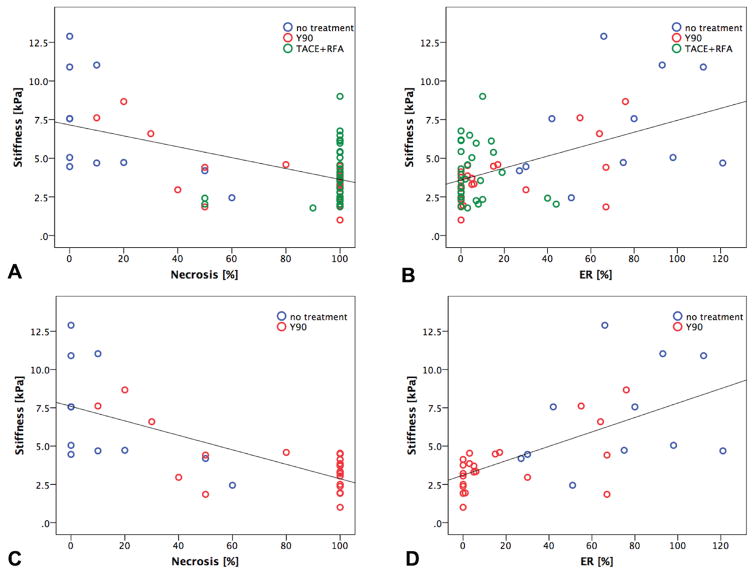
Results: 63 HCCs (mean size 3.2 ± 1.6 cm) were evaluated. TS was significantly lower in treated vs. untreated tumors (3.9 ± 1.8 vs. 6.9 ± 3.4 kPa, p = 0.006) and also compared to LS (5.3 ± 2.2 kPa, p = 0.002). There were significant correlations between TS and each of enhancement ratios (r = 0.514, p = 0.0001), and percentage of necrosis (r = -0.540, p = 0.0001). The observed correlations were stronger in patients treated with RE (TS vs. ER, r = 0.636, TS vs. necrosis, r = -0.711, both p = 0.0001). Percentage of necrosis and T1-signal in native T1WI were significant independent predictors of TS (p = 0.0001 and 0.001, respectively).
Conclusion: TS measured with MRE shows a significant correlation with tumor enhancement and necrosis, especially in HCCs treated with RE.
Keywords: Hepatocellular carcinoma; Locoregional therapy; MR elastography; Tumor stiffness.
Conflict of interest statement
The authors declare that they have no conflict of interest.
Figures
Similar articles
-
Liver stiffness measured by MR elastography is a predictor of early HCC recurrence after treatment.Eur Radiol. 2020 Aug;30(8):4182-4192. doi: 10.1007/s00330-020-06792-y. Epub 2020 Mar 18. Eur Radiol. 2020. PMID: 32189053
-
Evaluation of HCC response to locoregional therapy: Validation of MRI-based response criteria versus explant pathology.J Hepatol. 2017 Dec;67(6):1213-1221. doi: 10.1016/j.jhep.2017.07.030. Epub 2017 Aug 18. J Hepatol. 2017. PMID: 28823713
-
Hepatocellular carcinoma: assessment of response to transarterial chemoembolization with image subtraction.J Magn Reson Imaging. 2010 Feb;31(2):348-55. doi: 10.1002/jmri.22038. J Magn Reson Imaging. 2010. PMID: 20099348
-
Early effect of 90Y radioembolisation on hepatocellular carcinoma and liver parenchyma stiffness measured with MR elastography: initial experience.Eur Radiol. 2021 Aug;31(8):5791-5801. doi: 10.1007/s00330-020-07636-5. Epub 2021 Jan 21. Eur Radiol. 2021. PMID: 33475773
-
Can Liver Ultrasound Elastography Predict the Risk of Hepatocellular Carcinoma Recurrence After Radiofrequency Ablation? A Systematic Review and Meta-Analysis.Ultraschall Med. 2023 Jun;44(3):e139-e147. doi: 10.1055/a-1657-8825. Epub 2021 Nov 10. Ultraschall Med. 2023. PMID: 34758491 English.
Cited by
-
Quantitative and qualitative evaluation of liver metastases with intraprocedural cone beam CT prior to transarterial radioembolization as a predictor of treatment response.Res Diagn Interv Imaging. 2022 Apr 5;1:100005. doi: 10.1016/j.redii.2022.100005. eCollection 2022 Mar. Res Diagn Interv Imaging. 2022. PMID: 39077371 Free PMC article.
-
Immunotherapy response evaluation with magnetic resonance elastography (MRE) in advanced HCC.J Immunother Cancer. 2019 Nov 28;7(1):329. doi: 10.1186/s40425-019-0766-y. J Immunother Cancer. 2019. PMID: 31779702 Free PMC article.
-
Magnetic resonance elastography: beyond liver fibrosis-a case-based pictorial review.Abdom Radiol (NY). 2018 Jul;43(7):1590-1611. doi: 10.1007/s00261-017-1383-1. Abdom Radiol (NY). 2018. PMID: 29143076 Free PMC article. Review.
-
Hepatocellular carcinoma: State of the art diagnostic imaging.World J Radiol. 2023 Mar 28;15(3):56-68. doi: 10.4329/wjr.v15.i3.56. World J Radiol. 2023. PMID: 37035828 Free PMC article. Review.
-
Magnetic resonance elastography can predict development of hepatocellular carcinoma with longitudinally acquired two-point data.Eur Radiol. 2019 Feb;29(2):1013-1021. doi: 10.1007/s00330-018-5640-7. Epub 2018 Jul 24. Eur Radiol. 2019. PMID: 30043162
References
-
- Shields A, Reddy KR. Hepatocellular carcinoma: current treatment strategies. Curr Treat Options Gastroenterol. 2005;8(6):457–466. - PubMed
-
- Kulik LM, Atassi B, van Holsbeeck L, Souman T, Lewandowski RJ, Mulcahy MF, Hunter RD, Nemcek AA, Jr, Abecassis MM, Haines KG, 3rd, Salem R. Yttrium-90 microspheres (TheraSphere) treatment of unresectable hepatocellular carcinoma: downstaging to resection, RFA and bridge to transplantation. J Surg Oncol. 2006;94(7):572–586. doi: 10.1002/jso.20609. - DOI - PubMed
Publication types
MeSH terms
Substances
Grants and funding
LinkOut - more resources
Full Text Sources
Other Literature Sources
Medical
Miscellaneous
