. 2017 Feb 3:8:14172.
doi: 10.1038/ncomms14172.

Prenatal thalamic waves regulate cortical area size prior to sensory processing

Affiliations

Prenatal thalamic waves regulate cortical area size prior to sensory processing

Verónica Moreno-Juan et al. Nat Commun. .

Abstract

The cerebral cortex is organized into specialized sensory areas, whose initial territory is determined by intracortical molecular determinants. Yet, sensory cortical area size appears to be fine tuned during development to respond to functional adaptations. Here we demonstrate the existence of a prenatal sub-cortical mechanism that regulates the cortical areas size in mice. This mechanism is mediated by spontaneous thalamic calcium waves that propagate among sensory-modality thalamic nuclei up to the cortex and that provide a means of communication among sensory systems. Wave pattern alterations in one nucleus lead to changes in the pattern of the remaining ones, triggering changes in thalamic gene expression and cortical area size. Thus, silencing calcium waves in the auditory thalamus induces Rorβ upregulation in a neighbouring somatosensory nucleus preluding the enlargement of the barrel-field. These findings reveal that embryonic thalamic calcium waves coordinate cortical sensory area patterning and plasticity prior to sensory information processing.


Conflict of interest statement

The authors declare no competing financial interests.

Figures

Figure 1
Figure 1. Embryonic eye removal triggers experience-independent cross-modal changes in S1 somatosensory cortex.
(a) Brn3bCre/+;R26tdTomato mouse shows the absence of retinal axons in the dLGN at E14.5 and their presence at E15.5. (b) Labelling of principal sensory cortical areas at P8 in a control TCA-GFP transgenic mouse or in a TCA-GFP mouse in which bilateral enucleation has been performed embryonically. (c) Quantification of the areas of S1, V1 and A1 shown in b (***P<0.001 for S1 and V1; not significant (ns): P=0.76 for A1; Two-tailed Student's t-test). (d) vGlut2-immunostaining in the posteromedial barrel subfield (PMBSF) of S1 in control (n=10) and embBE (n=14) mice at P4. (e) Experimental design and quantification of the total PMBSF area shown in d (*P=0.03; Two-tailed Student's t-test). The expansion of the PMBSF in the embBE was proportional along the medio-lateral axis (630.30±39.04 pixels in control and 670.71±38.79 pixels in embBE) and the anterio-posterior axis (326.60±18.66 in control and 337.93±26.35 in embBE mice. (f) Plot of the area of each individual barrel (left) and quantification of the mean individual barrel area (right) in control and embBE brains at P4 (*P=0.011; Two-tailed Student's t-test). Inset describes the barrels that are significantly expanded in the embBE mice compared with controls. (g) Design of the experiment and quantification of the individual barrel area of control (n=13), control dewhiskered (n=16), embBE (n =12) and embBE dewhiskered (n=13) mice at P4 (*P<0.05; ns, not significant; Two-way ANOVA test with Tukey's post hoc analysis). Interaction between dewhiskering and embBE was not significant (P=0.77). (h) vGlut2-immunostaining in the VPM nucleus of the thalamus in control and embBE mice at P4, quantification of the total barreloid area (control 100±6.23%, n=4; embBE: 102.1±7.11%, n=4; P>0.99; Mann–Whitney U-test). Graphs represent mean±s.e.m. Scale bars, 1 mm in b and 300 μm in a,d,h.
Figure 2
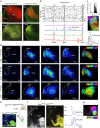
Figure 2. Thalamic spontaneous waves drive the communication between distinct thalamic nuclei.
(a) Fluorescence images of E16.5 Gbx2CreER/+;R26tdTomato 45 degrees thalamocortical acute slices loaded with the calcium indicator Cal520. Areas corresponding to the dLGN, VPM and MGv nuclei express tomato in function of the time of tamoxifen administration (upper panels). Maximum projection of Ca2+ waves (yellow) covering the three principal thalamic nuclei (lower panels). (b) Raster plot of the activity recorded in more than 250 individual cells in the dLGN-VPM during 10 min. The arrows label synchronous Ca2+ transients corresponding to Ca2+ waves. The lower panel shows examples of Ca2+ activity traces in four individual thalamic neurons (indicated by colour arrows in the raster plot) illustrating the three patterns of Ca2+ transients: asynchronous scattered, synchronous clusters and waves. (c) Cell-by-cell wave propagation. Upper panel: Percentage of neurons (over both dLGN and VPM nuclei) that are activated at every time point during wave propagation. Middle panel: Temporal spread of a wave front (colour coded). Lower panel: Examples of Ca2+ transients in four cells during a wave indicated in the middle panel (cell 1 initiated the wave). (d) Propagation of thalamic waves at E16.5 in acute slices: from the VPM into the dLGN (upper panels); from the dLGN into the VPM (middle panels); and from the VPM into the MGv nuclei (lower panels). The calcium signal intensity is coded in pseudocolour. Right panels for each wave show the temporal colour coded spread of the wave front from its origin (red zone) up to the borders of the nuclei. (e) Expression of GCaMP6-EGFP in embryonic acute thalamocortical slice from Gbx2CreER/+;R26GCaMP6-EGFP/+ mice with tamoxifen administrated at E10.5. (f) Acute slice showing GCaMP6 in the thalamocortical projections at E16.5 (left). Maximum projection of a Ca2+ wave from the same slice (right, yellow) showing the propagation of the thalamic waves to the cortex. Traces showing the progression of a wave from VPM (1) to dLGN (2) that propagated along the TCAs (1′ and 2′) up to distinct medio-lateral cortical territories (3 and 4). (g) Temporal colour-coded spread of the wave shown in f. Scale bars, 200 μm in a, 100 μm in c and 200 μm in dg.
Figure 3
Figure 3. Origin and propagation properties of thalamic waves.
(a) Site of origin (colour-coded filled contours) and corresponding maximum spread (colour outlines) of five successive waves originated in the dLGN–VPM and eight waves in the MGv–VPM nuclei. The area covered by the waves in the dLGN–VPM example was 149.728 μm2±5.873 μm2 and in the MGv–VPM example was 188.715 μm2±16.722 μm2. Insets represent examples of the propagation of wave 1 (red) and wave 2 (blue) for each pair. The white contours show the pattern of spread of the wave front measured at 250 ms intervals. (b) Quantification of the percentage of waves depending on the origin at E16.5. The vast majority of waves are originated in the VPM (**P=0.004; Paired t-test; *P=0.016; Wilcoxon matched-pairs signed rank test). (c) Schemas representing the stochastic nature of the thalamic waves origins for each pair of nuclei (dLGN–VPM; n=40 sites in five independent experiments; MGv–VPM, n=67 sites in five independent experiments). (d) Effect of bath application of the voltage-dependent sodium channels blocker tetrodoxin (TTX, 1 μM) on the Ca2+ activity. TTX completely abolished the thalamic waves without substantially affecting the asynchronous activity or the clusters. (e) Quantification of Ca2+ dLGN–VPM waves frequency before and during TTX administration. (f) Dose-dependent response in waves per minute, after increasing the extracellular potassium concentration from 5 mM (control) to 12 mM. (g) Effect of bath application of the gap junction blocker carbenoxolone (50 μM) on the Ca2+ activity. The most noticeable effect is the reversible abolition of the synchronous waves. (h) Quantification of Ca2+ dLGN–VPM waves frequency before, during and after carbenoxolone administration. Graphs represent mean±s.e.m. Scale bars, 250 μm.
Figure 4
Figure 4. Blocking the waves in the auditory nucleus alters the pattern of wave activity in the VPM and triggers an enlargement of the barrel-field in S1.
(a) Maximum projection of a Ca2+ wave (yellow) at the level of the MGv in an E16.5 control (upper panel, inset post hoc in situ hybridization of the auditory thalamic marker Crabp2) and in a MGvKir (lower panel) littermate. No waves are observed in the territory were Kir2.1 is overexpressed (mCherry). Raster plot of individual cells activity recorded during 10 min in the MGv of control (upper panel) and MGvKir (lower panel) mice. The Ca2+ transient labelled by the open arrow in the control reflects a Ca2+ wave. (b) Maximum projections of Ca2+ waves (yellow) propagating between the dLGN and VPM in an E16.5 control mouse (upper panels) and in a MGvKir littermate (lower panels). Additional waves (red arrows) remain restricted to the VPM in the MGvKir mouse (blue contours). (c) Upper panel shows the quantification of Ca2+ waves that propagate between dLGN–VPM in the control (n=6) and MGvKir (n=11) mice showing no significant change (dLGN–VPM: 0.20±0.04 waves per minute control; 0.21±0.04 waves per minute MGvKir, P=0.84). Lower panel shows the significant increase of de novo waves in the VPM in the MGvKir mouse (VPM: 0.20±0.04 waves per minute control; 0.34±0.04 waves per minute MGvKir, *P=0.028; Two-tailed Student's t-test). (d) vGlut2-immunostaining in tangential sections of the PMBSF in the S1 of P7 control (n=11) and MGvKir mice (n=12). Quantification of the PMBSF area in P7 MGvKir mice relative to the controls (**P=0.007; Two-tailed Student's t-test). (e) Maximum projections of Ca2+ waves in the embBE mouse at E17. Waves propagating between the dLGN and VPM (yellow) and de novo VPM waves (blue). (f) Quantification of the frequency of waves in the VPM in the embBE mouse (VPM: 0.16±0.03 waves per minute control; 0.29±0.03 waves per minute embBE, *P=0.019; Two-tailed Student's t-test). Graphs represent mean±s.e.m. Scale bars, 200 μm in a,b,e,f, and 300 μm in d.
Figure 5
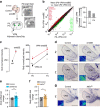
Figure 5. Both embBE and abolition of MGv waves induce changes in gene expression in the VPM thalamic nucleus.
(a) Scheme representing the microarray experiment. VPM nuclei were collected at P0 and P4, and the RNA was extracted and processed according to the Affymetrix GeneChip protocol. Bright field image showing a coronal slice after dissection of the VPM nucleus. (b) Scatter-plots showing significantly upregulated or downregulated transcripts (red and green circles, respectively) with a change of ≥1.5 or ≤−1.5-fold and a P value of ≤0.05 at P0 and P4. In the VPM, 106 transcripts were significantly regulated at P0 and 47 at P4, with an overall tendency towards upregulation. The top ten significantly upregulated or downregulated transcripts in the VPM are listed in red or green, respectively. (c) The expression of the Rorβ gene in VPM nucleus is upregulated by 1.9-fold at P0 in embBE mice (**P=0.008; Two-tailed Student's t-test). Between P0 and P4, Rorβ expression is upregulated in the VPM 2.4-fold in control mice (***P<0.001; Two-tailed Student's t-test) and 1.6-fold in embBE mice (*P=0.04; Two-tailed Student's t-test). (d) In situ hybridization for Rorβ in coronal sections from control and embBE animals at P0 and P4. Note the stronger expression of Rorβ in the VPM area (asterisk) of embBE animals compared with the controls. (e) Quantitative real-time PCR for Rorβ transcripts in VPM neurons, in control media (n=12) or after treatment with 25 mM of KCl (n=13) in acute slices at E16.5 (**P=0.0042, Two-tailed Student's t-test). (f) Quantitative real-time PCR for Rorβ in the VPM nucleus in control (n=11) and MGvKir (n=10) mice at E16.5 (*P=0.01, Mann–Whitney U-test). (g) In situ hybridization for Rorβ in coronal sections from control (n=5) and MGvKir (n=5) animals at P0. Graphs represent mean±s.e.m. Scale bars, 300 μm.
Figure 6
Figure 6. Thalamic Rorβ modulates the development of the somatosensory system and axonal branching.
(a) vGlut2-immunostaining in tangential sections of the PMBSF from control Nestin+/+;Rorβfl/fl (n=8) and NestinCre/+;Rorβfl/fl (n=7) mice at P8. (b) Quantification of the total PMBSF area shown in a (**P=0.0031; Two-tailed Student's t-test). (c) Plot of each individual barrel area and quantification of individual barrel area in control Nestin+/+;Rorβfl/fl (n=8) and NestinCre/+;Rorβfl/fl (n=7) brains (***P<0.001; Two-tailed Student's t-test). Insert describes the barrels that are significantly reduced in the double mutant mice. (d) Fluorescence images and representative drawings of thalamic neurons from E14.5 mice transfected with i-Gfp (n=33 neurons from three independent cultures) or Rorβ-i-Gfp (n=29 neurons from three independent cultures) and analysed at 10 days in vitro (DIV). (e) Quantification of branches per neuron at increasing branch orders (***P<0.001 for second, third and fourth branch orders; Mann–Whitney U-test). Quantification of the total neurite length per neuron (***P<0.001; Mann–Whitney U-test). (f) Flattened tangential sections showing vGlut2-immunostaining in S1 at P6 after Rorβ-i-Gfp (n=5) electroporation compared with control i-Gfp electroporated brains (n=4) at E11.5. Thalamic Rorβ overexpression induces the increase on the size of the individual barrel area. (g) Quantification of the individual barrel area at P6 in i-Gfp-electroporated and Rorβ-i-Gfp electroporated brains (*P=0.02; Mann–Whitney U-test). Insert describes the barrels that are significantly expanded after Rorβ-i-Gfp electroporation. (h) Coronal sections showing the axonal arborization of individual VPM neurons in a single barrel (immunolabelled with vGlut2) after electroporation with i-Gfp (n=12 neurons from four brains) or Rorβ-i-Gfp (n=12 neurons from nine brains). Right panel: example of single axons reconstruction under the two conditions. (i) Quantification of the axon terminal length and the area occupied by the axon terminals shown in h (**P=0.003 and **P=0.009; Two-tailed Student's t-test). Graphs represent mean±s.e.m. Scale bars, 300 μm for a and f, 100 μm for d and 20 μm for h.
Figure 7
Figure 7. Thalamic mechanism of coordinating sensory cortical areas territories mediated by the existence of spontaneous calcium waves.
Embryonically visual input deprived mice (embBE) show an expansion of the primary somatosensory cortex (S1) prior to sensory experience. This expansion of the barrel-field is triggered by activity-dependent gene regulation in the VPM. Both the embryonic abolishment on peripheral input or silencing thalamic waves in the auditory nucleus of the thalamus (MGv) leads to an increase wave activity in the VPM, which triggers Rorβ expression and an expansion of the barrel-field in S1. When the MGv auditory thalamic waves are silenced, the expression of Rorβ is decreased and this effect predates the reduction of the A1 area.

References

    1. Miyashita-Lin E., Hevner R., Wassarman K., Martinez S. & Rubenstein J. Early neocortical regionalization in the absence of thalamic innervation. Science 285, 906–909 (1999). - PubMed
    1. O'Leary D. D., Chou S. J. & Sahara S. Area patterning of the mammalian cortex. Neuron 56, 252–269 (2007). - PubMed
    1. Grove E. A. & Fukuchi-Shimogori T. Generating the cerebral cortical area map. Annu. Rev. Neurosci. 26, 355–380 (2003). - PubMed
    1. Garel S., Huffman K. J. & Rubenstein J. L. Molecular regionalization of the neocortex is disrupted in Fgf8 hypomorphic mutants. Development 130, 1903–1914 (2003). - PubMed
    1. Rakic P. Specification of cerebral cortical areas. Science 241, 170–176 (1988). - PubMed

Publication types