. 2017 Feb 3:6:e22472.
doi: 10.7554/eLife.22472.

Codon optimization underpins generalist parasitism in fungi

Affiliations

Codon optimization underpins generalist parasitism in fungi

Thomas Badet et al. Elife. .

Abstract

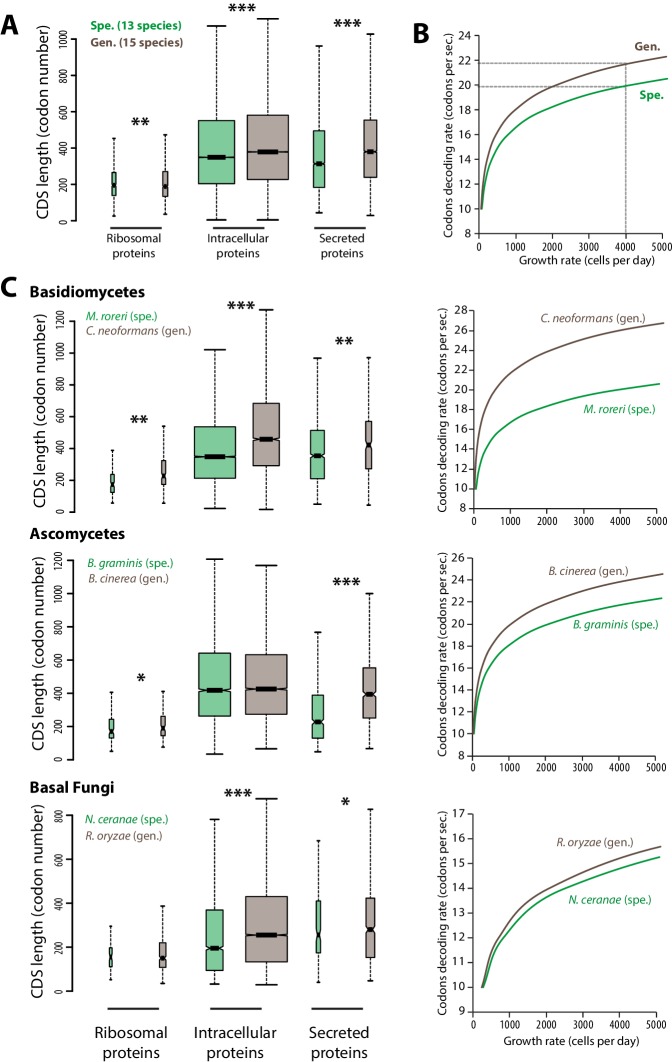
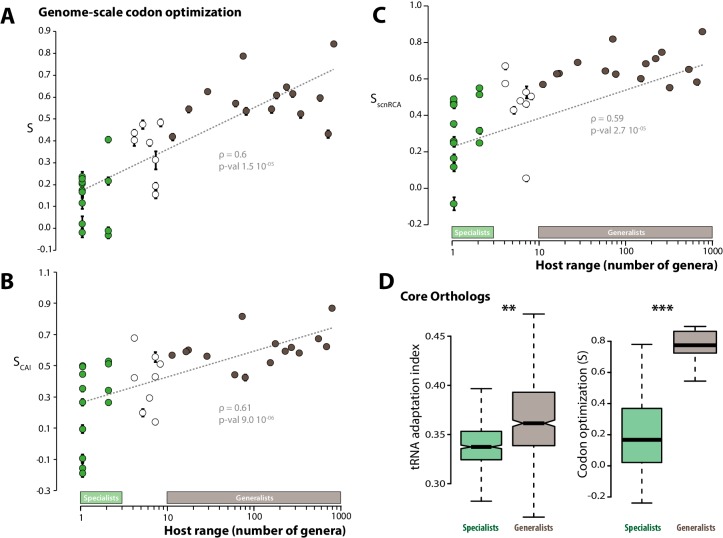
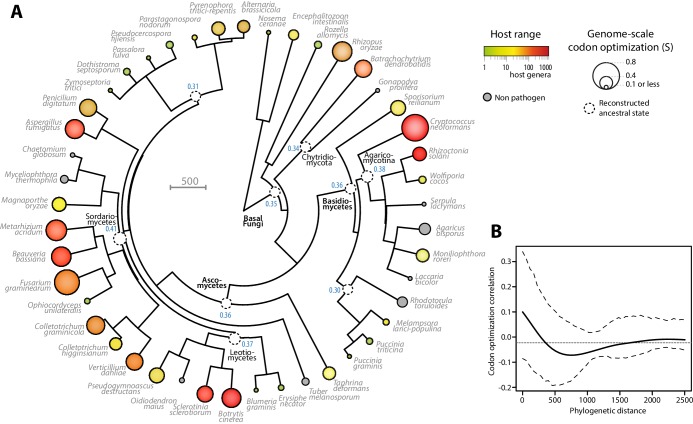
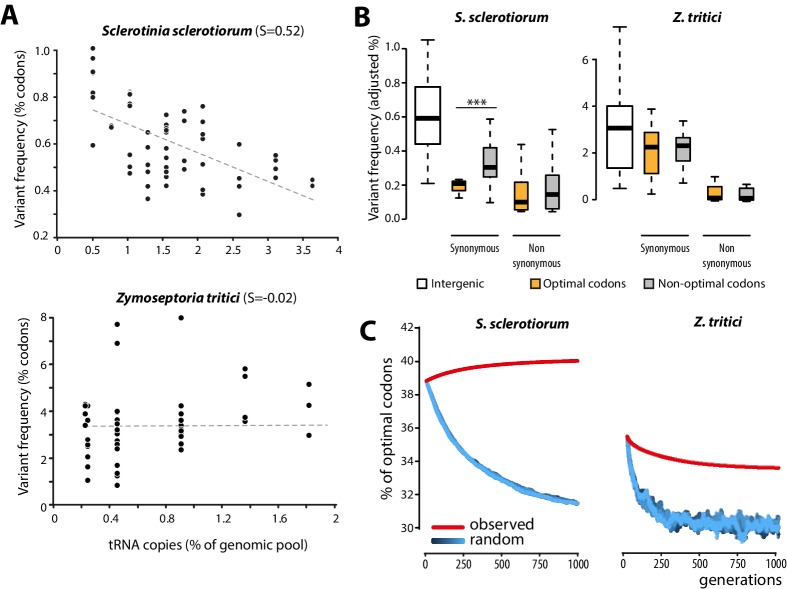
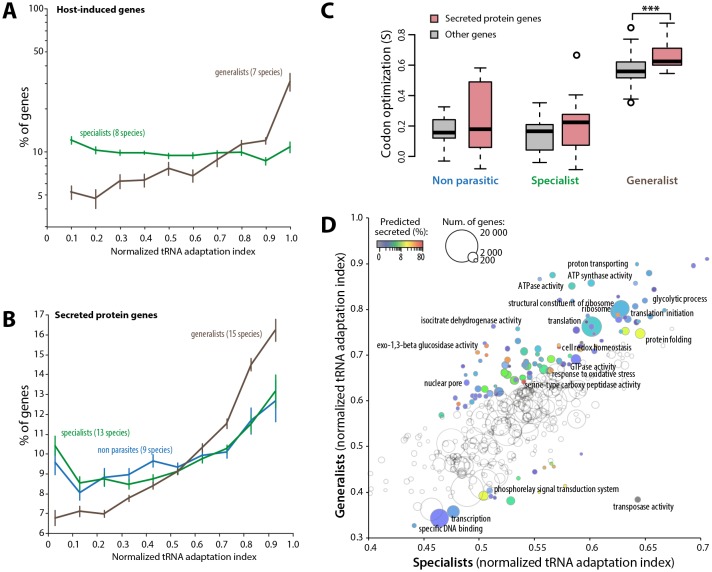
The range of hosts that parasites can infect is a key determinant of the emergence and spread of disease. Yet, the impact of host range variation on the evolution of parasite genomes remains unknown. Here, we show that codon optimization underlies genome adaptation in broad host range parasites. We found that the longer proteins encoded by broad host range fungi likely increase natural selection on codon optimization in these species. Accordingly, codon optimization correlates with host range across the fungal kingdom. At the species level, biased patterns of synonymous substitutions underpin increased codon optimization in a generalist but not a specialist fungal pathogen. Virulence genes were consistently enriched in highly codon-optimized genes of generalist but not specialist species. We conclude that codon optimization is related to the capacity of parasites to colonize multiple hosts. Our results link genome evolution and translational regulation to the long-term persistence of generalist parasitism.

Keywords: codon usage; evolutionary biology; fungal parasites; genome evolution; genomics; host range.


Conflict of interest statement

The authors declare that no competing interests exist.

Figures

Figure 1.
Figure 1.. Contrasted length distribution in proteomes is expected to increase selection on codon optimization in generalist fungi.
(A) Distribution of length (number of codons) in the ribosomal, intracellular and predicted secreted proteomes of 13 specialist fungal parasites and 15 generalist fungal parasites. (B) Relationship between codon decoding rate (number of codons translated per second) and cell growth rate of typical specialist and generalist fungi predicted by a cellular model of protein translation. Dotted lines highlight the higher codon decoding rate required in generalist fungi compared to specialist fungi to achieve a growth rate of 4000 cells produced per day. (C) Distribution of length in the proteomes (left) and relationship between codon decoding rate and cell growth rate (right) in related specialist and generalist fungi from the Basidiomycetes, Ascomycetes and Basal Fungi. The width of boxplots is proportional to the number of values. Spe., specialist (green); Gen., generalist (brown). Welch’s t-test p: *<10−01, **<10−04, ***<10−08. DOI: http://dx.doi.org/10.7554/eLife.22472.002
Figure 2.
Figure 2.. Codon optimization correlates with host range in fungal parasites.
Genome-scale codon optimization correlates with host range in 36 parasites across the kingdom Fungi. Species considered as specialists (less than four host genera) are shown in green, species considered as generalists (over 10 host genera) are shown in brown. Error bars show 95% confidence interval, dotted line shows logarithmic regression of the data. Codon optimization calculated based on knowledge on the tRNA pool (A), on codon usage in ribosomal protein genes (B) and on self-consistent relative codon adaptation (C) correlated with host range at Spearman ρ≥0.59 (p≤2.7 10−05) under phylogenetic independent contrasts. (D) Codon optimization is stronger in core orthologs from generalist fungal parasites than in core orthologs from specialist fungal parasites. Left: Distribution of tRNA adaptation indices in 1620 core ortholog genes show significantly higher values in generalist fungi (**, Welch’s t-test p<0.01). Right: Codon optimization calculated as the degree of coadaptation of core ortholog genes to the genomic tRNA pool is significantly higher in generalist fungi (***, Welch’s t-test p<10−04). DOI: http://dx.doi.org/10.7554/eLife.22472.004
Figure 3.
Figure 3.. Codon optimization and host range co-evolved multiple times across fungal phylogeny.
(A) Phylogeny, genome-scale codon optimization and host range in 36 parasites across the kingdom Fungi. Nine non-pathogenic species belonging to the major branches of Fungi are shown for comparison. The phylogenetic tree was generated using the TimeTree database (Hedges et al., 2015) and PATHd8 (Britton et al., 2007). Codon optimization shown as the size of terminal nodes corresponds to the degree S of coadaptation of all genes to the genomic tRNA pool (dos Reis et al., 2004). Terminal nodes are sized according to genome-scale codon optimization and colored according to host range (grey was used for non pathogen species). Internal nodes are sized according to reconstructed ancestral genome-scale codon optimization, with ancestral S value indicated as a blue label. (B) Correlogram of genome-scale codon optimization and phylogenetic distance along the tree shown in A. Dotted lines delimit 95% confidence interval. DOI: http://dx.doi.org/10.7554/eLife.22472.008
Figure 4.
Figure 4.. Biased synonymous substitution patterns underpin codon optimization in local populations of a generalist but not a specialist fungal parasite.
(A) Genome-wide frequencies of variant codons in local populations of the host generalist Sclerotinia sclerotiorum and the host specialist Zymoseptoria tritici, according to the number of genomic copies of cognate tRNAs. The number of cognate tRNAs for each codon type was determined using wobble rules for codon-anticodon pairing. Dotted lines show linear regression of the data (Z. tritici: Pearson ρ = 0.06; p=0.62; S. sclerotiorum ρ = −0.60; p=4.6 10−07). (B) Adjusted variant frequencies for intergenic nucleotide triplets, optimal and non-optimal codons. Synonymous and non-synonymous SNPs are shown separately. Differences between optimal and non-optimal codon rates were assessed by Welch’s t-test (***p<0.001). (C) Predicted evolution of genome-wide content in optimal codons in S. sclerotiorum and Z. tritici based on observed and random mutation patterns. DOI: http://dx.doi.org/10.7554/eLife.22472.011
Figure 4—figure supplement 1.
Figure 4—figure supplement 1.. Experimental determination of S. sclerotiorum tRNA accumulation supports a good correlation between genomic copy numbers and tRNA accumulation.
The accumulation of tRNA transcripts was determined by sequencing small RNAs of S. sclerotiorum grown in vitro and in planta. (A) Normalized read depth correlated exponentially with tRNA copy number for each tRNA species both in vitro and in planta. (B) A comparison of tRNA transcripts accumulation in vitro and in planta. Correlation of tRNA transcripts accumulation with codon usage (C) and tRNA adaptive value (D) calculated as described in dos Reis et al. (2004). The exponential regression of the data is shown as a dotted line. The Spearman rank correlation coefficient ρ and the p-value for Spearman’s test are given. DOI: http://dx.doi.org/10.7554/eLife.22472.015
Figure 4—figure supplement 2.
Figure 4—figure supplement 2.. Analysis of Single Nucleotide Polymorphisms (SNPs) in a natural population of the generalist plant pathogen Sclerotinia sclerotiorum.
(A) IGS-based phylogeny of the S. sclerotiorum isolates re-sequenced in this work. (B) Frequency of SNPs according to codon position and SNP type. (C) SNPs in coding regions do not show significant bias toward enrichment in A or T nucleotides as shown by the rate of AT conversion. (D) Frequency of each substitution type among synonymous, non-synonymous and intergenic SNPs shows higher transition rate among synonymous substitutions. (E) Transition/transversion ratio per SNP type shows ~threefold increase in synonymous substitutions. (B–E) Error bars show the standard deviation of means for each isolate. Distribution of non-synonymous (F) and synonymous (G) SNPs among the five re-sequenced isolates. DOI: http://dx.doi.org/10.7554/eLife.22472.016
Figure 5.
Figure 5.. Codon optimization strongly associates with host colonization in generalist fungal parasites.
(A) Genes induced during host infection are enriched among high tRNA adaptation index genes in generalist but not specialist parasite genomes. Error bars show standard error of the mean. (B) Genes encoding predicted secreted proteins are more strongly enriched among high tRNA adaptation index genes in generalist parasite genomes compared to specialist and non-parasitic fungi genomes. Error bars show standard error of the mean. (C) Degree of coadaptation of secreted protein genes and other genes to the genomic tRNA pool in non parasitic, specialist and generalist fungi (*** Student’s paired t-test p<0.002). (D) Distribution of tRNA adaptation indices according to gene functions in generalist and specialist fungal parasites. For each Gene Ontology (GO), the average normalized tRNA adaptation indices in all genes from generalist and specialist genomes are shown. Bubbles are sized according to the total number of genes, and colored according to the percentage of predicted secreted proteins when values for generalists and specialists differ by over 10%. Selected GOs are labeled. DOI: http://dx.doi.org/10.7554/eLife.22472.017

References

    1. Amselem J, Cuomo CA, van Kan JA, Viaud M, Benito EP, Couloux A, Coutinho PM, de Vries RP, Dyer PS, Fillinger S, Fournier E, Gout L, Hahn M, Kohn L, Lapalu N, Plummer KM, Pradier JM, Quévillon E, Sharon A, Simon A, ten Have A, Tudzynski B, Tudzynski P, Wincker P, Andrew M, Anthouard V, Beever RE, Beffa R, Benoit I, Bouzid O, Brault B, Chen Z, Choquer M, Collémare J, Cotton P, Danchin EG, Da Silva C, Gautier A, Giraud C, Giraud T, Gonzalez C, Grossetete S, Güldener U, Henrissat B, Howlett BJ, Kodira C, Kretschmer M, Lappartient A, Leroch M, Levis C, Mauceli E, Neuvéglise C, Oeser B, Pearson M, Poulain J, Poussereau N, Quesneville H, Rascle C, Schumacher J, Ségurens B, Sexton A, Silva E, Sirven C, Soanes DM, Talbot NJ, Templeton M, Yandava C, Yarden O, Zeng Q, Rollins JA, Lebrun MH, Dickman M. Genomic analysis of the necrotrophic fungal pathogens Sclerotinia sclerotiorum and Botrytis cinerea. PLoS Genetics. 2011;7:e1002230. doi: 10.1371/journal.pgen.1002230. - DOI - PMC - PubMed
    1. Bailey BA, Melnick RL, Strem MD, Crozier J, Shao J, Sicher R, Phillips-Mora W, Ali SS, Zhang D, Meinhardt L. Differential gene expression by Moniliophthora roreri while overcoming cacao tolerance in the field. Molecular Plant Pathology. 2014;15:711–729. doi: 10.1111/mpp.12134. - DOI - PMC - PubMed
    1. Barrett LG, Kniskern JM, Bodenhausen N, Zhang W, Bergelson J. Continua of specificity and virulence in plant host-pathogen interactions: causes and consequences. New Phytologist. 2009;183:513–529. doi: 10.1111/j.1469-8137.2009.02927.x. - DOI - PubMed
    1. Beg QK, Vazquez A, Ernst J, de Menezes MA, Bar-Joseph Z, Barabási AL, Oltvai ZN. Intracellular crowding defines the mode and sequence of substrate uptake by Escherichia coli and constrains its metabolic activity. PNAS. 2007;104:12663–12668. doi: 10.1073/pnas.0609845104. - DOI - PMC - PubMed
    1. Blomberg SP, Garland T, Ives AR. Testing for phylogenetic signal in comparative data: behavioral traits are more labile. Evolution. 2003;57:717–745. doi: 10.1111/j.0014-3820.2003.tb00285.x. - DOI - PubMed

Publication types

LinkOut - more resources