. 2017 Feb 2;65(3):460-475.e6.
doi: 10.1016/j.molcel.2017.01.013.

Not All H3K4 Methylations Are Created Equal: Mll2/COMPASS Dependency in Primordial Germ Cell Specification

Affiliations

Not All H3K4 Methylations Are Created Equal: Mll2/COMPASS Dependency in Primordial Germ Cell Specification

Deqing Hu et al. Mol Cell. .

Abstract

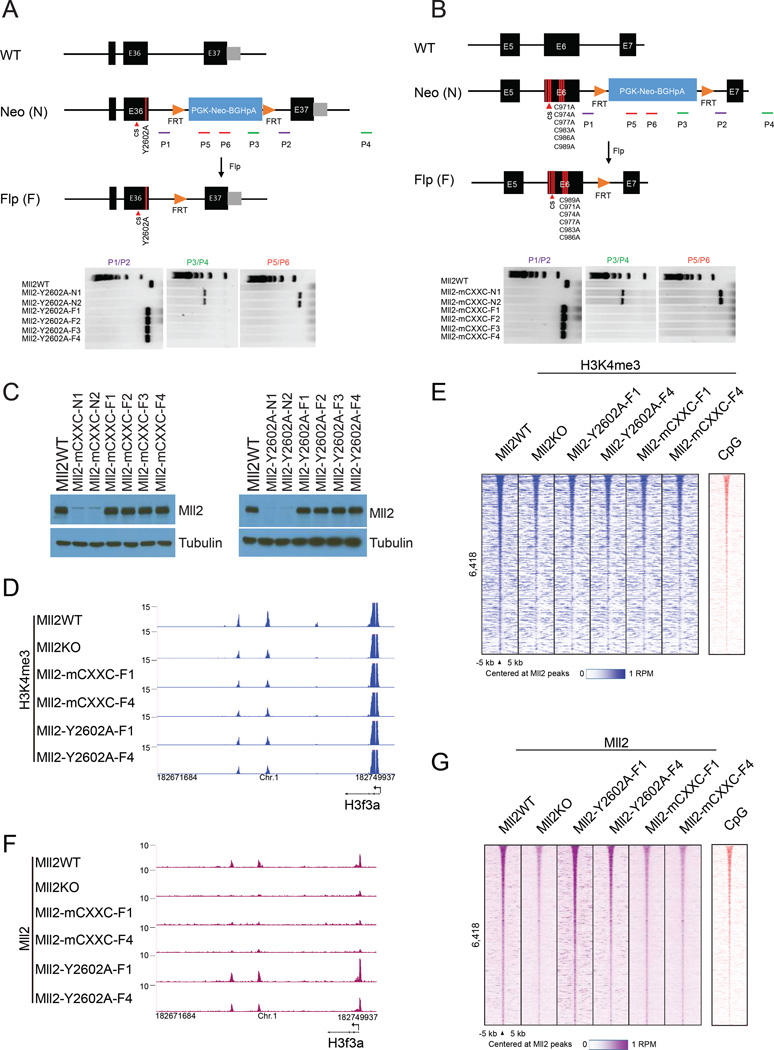
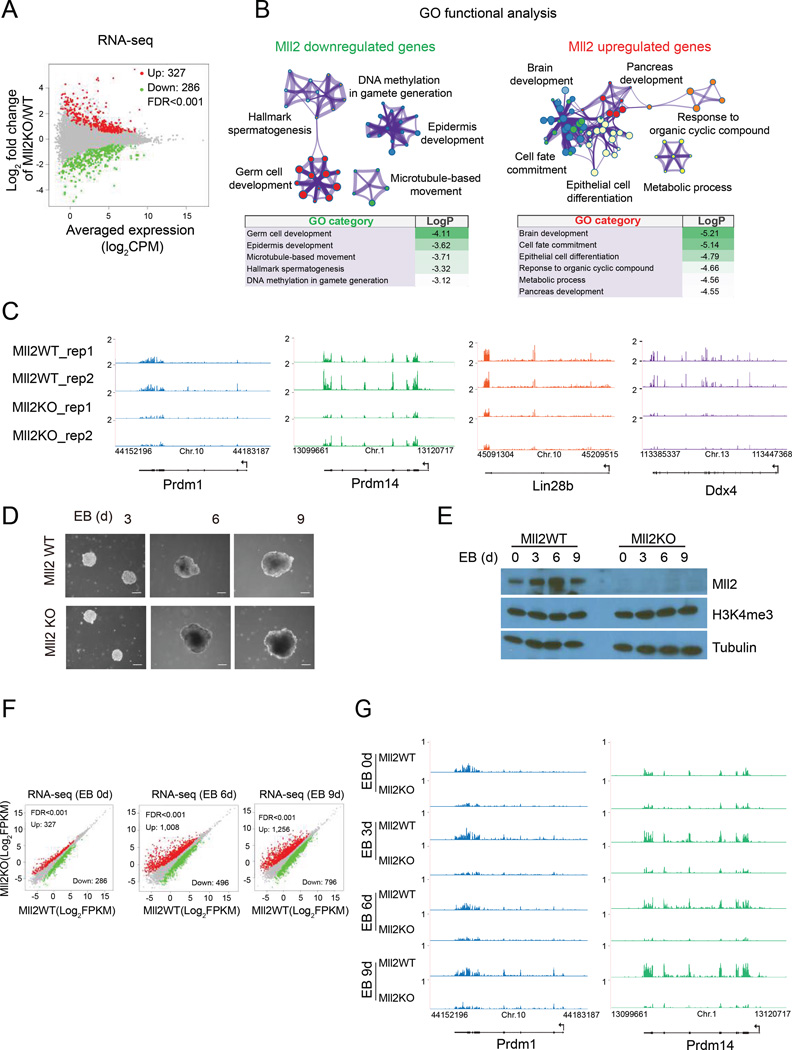
The spatiotemporal regulation of gene expression is central for cell-lineage specification during embryonic development and is achieved through the combinatorial action of transcription factors/co-factors and epigenetic states at cis-regulatory elements. Here, we show that in addition to implementing H3K4me3 at promoters of bivalent genes, Mll2 (KMT2B)/COMPASS can also implement H3K4me3 at a subset of non-TSS regulatory elements, a subset of which shares epigenetic signatures of active enhancers. Our mechanistic studies reveal that association of Mll2's CXXC domain with CpG-rich regions plays an instrumental role for chromatin targeting and subsequent implementation of H3K4me3. Although Mll2/COMPASS is required for H3K4me3 implementation on thousands of loci, generation of catalytically mutant MLL2/COMPASS demonstrated that H3K4me3 implemented by this enzyme was essential for expression of a subset of genes, including those functioning in the control of transcriptional programs during embryonic development. Our findings suggest that not all H3K4 trimethylations implemented by MLL2/COMPASS are functionally equivalent.

Keywords: CXXC domain; Histone-Lysine N-Methyltransferase; Kmt2b; Mll2; chromatin; embryonic development; gene expression regulation; histone; mouse embryonic stem cell; primordial germ cell.


Figures

Figure 1
Figure 1. Mll2/COMPASS catalyzes H3K4me3 at non-TSS Mll2 binding sites
(A) Pie chart of genome-wide Mll2 distribution in mESC determined by ChIP-seq with ab CT2. (B) Mll2 occupancy at TSS and non-TSS regions (C) Genome browser tracks of Mll2, p300, H3K4me1 and H3K27ac at putative enhancers. (D–E) Binary enrichment profiles (D) and binding percentages (E) for Mll2, p300, H3K4me1, H3K27ac, H3K27me3, and H3K4me3 ± 5kb regions centered at 6,418 high-confidence non-TSS Mll2 peaks. Enrichment determined by p < 1e-8 and FDR < 0.05. (F) Percentage of 6,418 high-confidence non-TSS Mll2 bound regions that are enriched for indicated histone marks. Group I regions have enrichment for p300, H3K4me1 and H3K27ac, while Group II regions exhibit occupancy of p300, H3K4me1, H3K27ac and H3K4me3. (G) Gene expression analysis of RNA-seq data in mESC for all genes, nearest genes of all 6,418 high-confidence non-TSS Mll2 peaks, or Mll2-associated Group I and Group II regions. Boxes display the 25–75% ranked genes with the median indicated as an intersection. P-value determined by Wilcoxon rank-sum test. (H) ChIP-seq profiles for H3K4me3 and Mll2 at putative enhancer regions from (C) in mESC infected with lentiviral shRNAs targeting Mll2 (shMll2) or control (shGFP). (I) ChIP-qPCR validation of changes at putative enhancers indicated in (H). ChIP signals were calculated as percentages of input and then normalized to that obtained from shGFP cells and presented in the log2 scale. Error bars represent two technical replicates in a representative experiment of at least three biological replicates. (J) Heat map of Mll2 and H3K4me3 ChIP-seq occupancy ± 5kb at the 6,418 non-TSS Mll2 peaks in Mll2 and control knockdown cells (Left). H3K4me3 log2 fold change after Mll2 depletion is shown 5kb flanking 6,418 non-TSS Mll2 peaks (Middle). H3K27ac occupancy for the same regions is shown (Right). The heat map is rank-ordered from 6,418 sites with highest to lowest occupancy of Mll2 in mESC. (K) Boxplot representation of ChIP-seq occupancy for Mll2 and H3K4me3 at 6,418 non-TSS Mll2 targets. P-values determined by Wilcox on rank sum test. See also Figure S1.
Figure 2
Figure 2. Rescue strategy for dissecting Mll2 activities in mESC
(A) Top panel, graphical representation of the Mll2 locus and two CRISPR/Cas9 target locations. Target sites are indicated in green and PAM sequences in red. Bottom panel, wild-type and mutant sequenced clones. Size of deletion indicated in base pairs (bp). (B) Western analysis of Mll2 protein and histone H3K4 methylation levels in wild-type (WT) and a representative Mll2 knockout (Mll2KO) mESC clone. Triangles indicate increasing loaded extract. (C) Schematic of the human MLL2 domain structure and derivatives used in rescue experiments. Amino acids 958 to 1000 were deleted in the MLL2 (ΔCXXC) mutant rescue fragment. The catalytic mutant (Y2604A) is indicated with red star in the SET domain. (D) Western analysis of Mll2 protein levels in parental and Mll2KO mESC rescued with empty vector, N-terminally Halo-tagged wild-type, ΔCXXC, or catalytically deficient MLL2. All rescue cell lines express human MLL2 near endogenous mouse Mll2 levels. (E) MLL2 (ΔCXXC) and MLL2 (Y2604A) properly associate with in an MLL2/C0MPASS-like complex. Mouse V6.5 cells electroporated with indicated plasmids were immunoprecipitated with Halo antibody and eluates were analyzed by immunoblottig using antibodies against Menin, Rbbp5, Ash21, Wdr5 and Halo tag. (F) UCSC genome browser tracks of H3K4me3 occupancy near H3f3a in parental and Mll2KO mESC with empty vector, or wild-type, ΔCXXC, or catalytically deficient MLL2. (G) Heat map of H3K4me3 occupancy at 6,418 non-TSS Mll2 sites in wild-type, KO or rescue cells from (F). H3K4me3 ChIP-seq signal is represented as in Figure 1 J. CpG enrichment is shown in the right-most panel. (H) Boxplot analysis of H3K4me3 occupancy from (G). Boxes represent 25th and 75th percentiles. P-values determined by Wilcoxon rank sum test. (I) Heat map analysis of Mll2 occupancy at 6,418 non-TSS Mll2 sites in wild-type, KO or rescue cells from (F). Mll2 occupancy represented as in (1J). CpG enrichment is from (G). (J) Boxplot analysis of Mll2 occupancy from (I). P-values were calculated using the Wilcoxon rank sum test. See also Figure S2.
Figure 3
Figure 3. CRISPR editing demonstrates requirements for Mll2’s CXXC and catalytic domains in mESC
(A) Upper panel: Strategy for disrupting the catalytic activity of Mll2 in mESC. A homology repair template changes the catalytic tyrosine 2602 to alanine. The CRISPR-cas9 cleavage site is indicated with a red arrowhead. Primers (P1 to P6) used for genotyping are shown as bars with primer pairs color-coded. Lower panel: Agarose gel electrophoresis of PCR genotyping products in clones before (N) and after (F) flippase (Flp)-mediated eviction of the Neo cassette. Note that PCR products are unsuccessfully amplified with primers P1 and P2 in two targeted ES cell clones due to the large Neo cassette but can be amplified after FLP-mediated excision of Neo, with the PCR product migrating slower than the wild-type product due to a remaining FRT site. (B) Upper panel: Strategy for mutating the CXXC domain of Mll2 in mESC. CRISPR-cas9 cleavage site primer pairs indicated as in (A). Lower panel: Agarose gel analysis of PCR genotyping as in (A). (C) Western analysis of Mll2 protein levels in targeted ES cell clones before and after FLP-mediated eviction of Neo. Note that Mll2 protein is absent in two mESC clones before Neo excision (N1-N2) but mutant Mll2 is present at wild-type levels in four clones(F1-F4) after FLP-mediated excision of Neo. (D) UCSC genome browser track example of H3K4me3 occupancy near the H3f3a locus in parental, Mll2 knockout, CXXC and catalytic mutant Mll2 mESC. (E) Heat map representation of H3K4me3 occupancy at Mll2 non-TSS sites in parental, and the indicated mutant Mll2 mESC. (F) UCSC genome browser track example of Mll2 occupancy near the H3f3a locus in parental and the indicated mutant Mll2 mESC. (G) Heat map analysis of Mll2 occupancy at Mll2 non-TSS sites in parental, and the indicated mutant Mll2 mESC. ChIP-seq signal represented as in Figure 1J. See also Figure S3.
Figure 4
Figure 4. Mll2 is required for full expression of PGC genes during differentiation
(A) MA plot of gene expression changes between parental and Mll2KO mESC as determined by RNA-seq. The x axis shows the log2 normalized counts per million (CPM) of averaged expression in the two conditions (A) and the y axis shows the log2 fold change in the two conditions (M). Significantly upregulated and downregulated are highlighted in red and green, respectively (FDR<0.001). (B) Gene Ontology (GO) functional analysis for differentially expressed genes as determined by Metascape (Tripathi et al., 2015). Each node represents a functional term and its size is proportional to the number of genes falling into that term, with the color representing the cluster identity. Terms with a similarity score > 0.3 are linked by an edge. Log p-values are shown below the GO networks. (C) UCSC genome browser RNA-seq tracks for regulators of PGC specification in parental and Mll2 knockout mESC. (D) Representative phase contrast images of embryoid bodies (EBs) at indicated days derived from parental (Mll2 WT) and Mll2KO mESC. (E) Western analysis of Mll2 levels during mESc cell differentiation into embryoid bodies. Tubulin serves as a loading control. (F) Scatter plots showing differential gene expression of EBs derived from parental and Mll2KO mESC at different day points. Differentially expressed genes determined as in (A). (G) UCSC genome browser RNA-seq tracks at Prdm1 and Prdm14 loci in mESC and indicated days of EB formation. See also Figure S4.
Figure 5
Figure 5. Mll2’s CXXC domain and catalytic activity function in PGC specification
(A) Heat map of gene expression in mESC after Mll2 knockout, mutation of the catalytic SET domain, or functional disruption of Mll2’s CXXC domain. Differentially expressed genes are separated into two groups based on their up- or down- regulation in Mll2 knockout cells. (B) UCSC genome browser tracks of total RNA-seq in wild-type and indicated Mll2 mutant conditions. Top four tracks are from Figure 4C. (C) Representative phase contrast images of 6 day EBs derived from parental, Mll2KO, CXXC and catalytically deficient mESC. (D) UCSC genome browser RNA-seq tracks at Prdm14 in mESC and 6 day EB. (E) Schematic of in vitro generation of primordial germ cell-like cells (PGCLC) (upper panel). Expression of representative PGC, endoderm and ectoderm genes in PGCLC aggregates was determined by quantitative reverse transcription PCR and normalization to Gapdh. Expression is relative to expression in PGCLC aggregates derived from parental mESC. Bars represent the standard deviation for two technical replicates, representative of three biological experiments. (F) FACS analysis of PGCLC derived as in (E) from a representative experiment is shown (left panel) and the average results from two independent quantifications are plotted (right panel). P-values are calculated using the t-test. See also Figure S5.
Figure 6
Figure 6. Mll2 and putative enhancers of PGC determinants
(A) ChIP-seq genome browser tracks showing Mll2-dependent H3K4me3 at two putative enhancers (En1 and En2) each near Prdm1 and Prdm14 in mESC. A non-bound element (NBE) at each locus is also indicated. (B) Schematic of CRISPR/Cas9 design for candidate enhancer deletion. Black arrows indicate the location of genomic regions targeted by CRISPR guide RNAs. P1, P2, P3 and P4 represent primers used for genotyping. For each construct, the protospacer sequence and the Cas9-specific proximal-adjacent motif (PAM) are underlined in green and red, respectively. (C) Genotyping of mESC transfected with candidate enhancer-flanking CRISPR constructs identified five clones with deletion of Prdm 14 putative enhancers and three clones with deletion of the distal putative Prdm 1 enhancer. (D) RNA-seq genome browser tracks of Prdml and Prdml4 in parental and three representative clones of the Prdml orPrdml4 enhancer-deleted mES cells. (E) Physical interactions of Mll2-regulated putative enhancers with promoters of Prdml and Prdml4 as revealed by circularized chromosome conformation capture with high-throughput sequencing (4C) assay. The median and 20th and 80th percentiles of a sliding 10 kb window determine the main trend line. Color scale represents enrichment relative to the maximum median value at a resolution of 12 kb. (F) Luciferase reporter assay of the role of putative enhancers of Prdm 14 (left) and Prdml (right) in transcriptional activation in the presence of wild-type, ΔCXXC, or catalytically deficient mutant human MLL2. Enhancers (En), non-binding element (NBE) or promoter (Pr) regions indicated in (A), were cloned into a luciferase reporter vector and co-transfected into HEK293 cells with the indicated MLL2 construct. After 48h, cells were harvested, and luciferase activity was determined. Relative luciferase induction is plotted as fold change compared to cells transfected with empty control vectors. (G) Parental, Mll2KO or Prdm14 enhancer-deleted mESC were differentiated into PGCLCs in vitro. After 6 days, PGCLCs were quantified by FACS. Percentage of PGCLCs induced from parental, Mll2KO and Prdm14 enhancer-deleted mESC in a representative experiment and the average results from two independent quantifications are presented. P-values are calculated using the t-test. See also Figure S6.
Figure 7
Figure 7. A working model for Mll2/COMPASS during development. (1st panel)
Mll2/COMPASS can be recruited to both enhancers and promoters through CXXC-dependent binding of CpG-rich regions and implements H3K4me3 for the expression of master regulators of PGC specification. (2nd panel) During differentiation, Mll2−/− cells are not capable of transcriptional activation of PGC factors, resulting in defective PGC specification. (3rd panel) Mll2mCXXC/mCXXC is incompetent to occupy enhancers and promoters of PGC regulators, leading to compromised PGC specification. (4th panel) Catalytically deficient Mll2Y2602A/Y2602A is recruited to enhancers and promoters of PGC regulators, but fails to implement H3K4 methylation and leads to compromised PGC specification.

References

    1. Andreu-Vieyra CV, Chen R, Agno JE, Glaser S, Anastassiadis K, Stewart AF, Matzuk MM. MLL2 is required in oocytes for bulk histone 3 lysine 4 trimethylation and transcriptional silencing. PLoS Biol. 2010:8. - PMC - PubMed
    1. Ayton PM, Chen EH, Cleary ML. Binding to nonmethylated CpG DNA is essential for target recognition, transactivation, and myeloid transformation by an MLL oncoprotein. Molecular and cellular biology. 2004;24:10470–10478. - PMC - PubMed
    1. Azuara V, Perry P, Sauer S, Spivakov M, Jorgensen HF, John RM, Gouti M, Casanova M, Warnes G, Merkenschlager M, et al. Chromatin signatures of pluripotent cell lines. Nat Cell Biol. 2006;8:532–538. - PubMed
    1. Bernstein BE, Mikkelsen TS, Xie X, Kamal M, Huebert DJ, Cuff J, Fry B, Meissner A, Wernig M, Plath K, et al. A bivalent chromatin structure marks key developmental genes in embryonic stem cells. Cell. 2006;125:315–326. - PubMed
    1. Castrillon DH, Quade BJ, Wang TY, Quigley C, Crum CP. The human VASA gene is specifically expressed in the germ cell lineage. Proceedings of the National Academy of Sciences of the United States of America. 2000;97:9585–9590. - PMC - PubMed

MeSH terms