. 2017 Apr:504:63-72.
doi: 10.1016/j.virol.2017.01.017. Epub 2017 Jan 31.

Respiratory syncytial virus infection induces a subset of types I and III interferons in human dendritic cells

Affiliations

Respiratory syncytial virus infection induces a subset of types I and III interferons in human dendritic cells

Philippa Hillyer et al. Virology. 2017 Apr.

Abstract

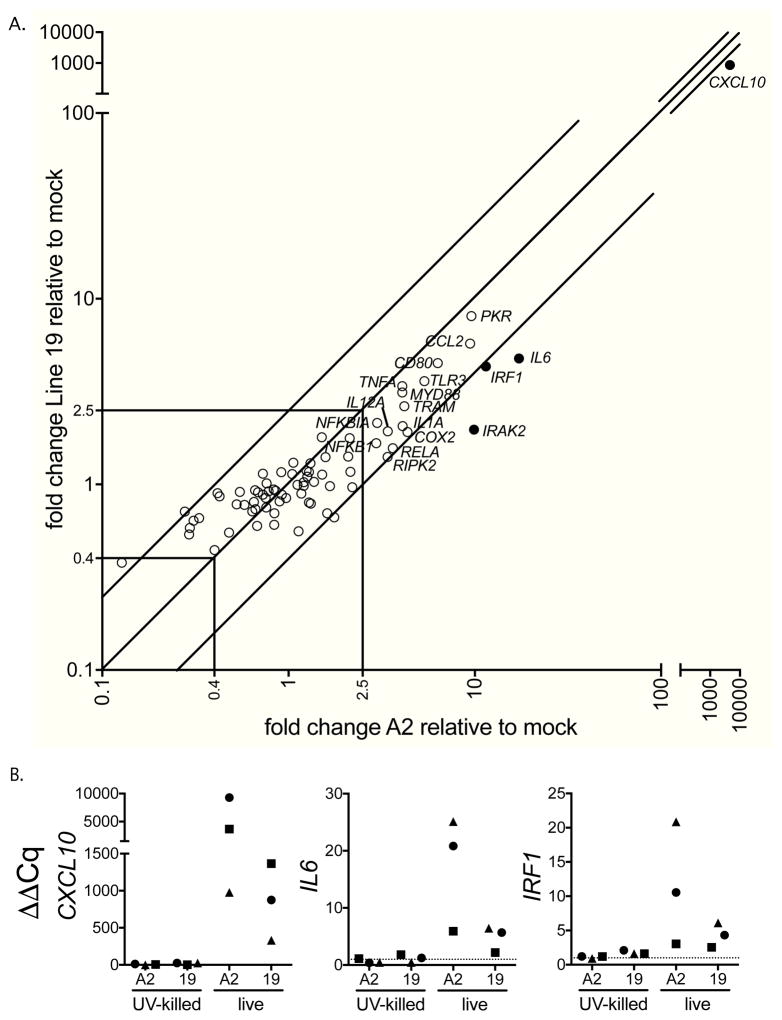
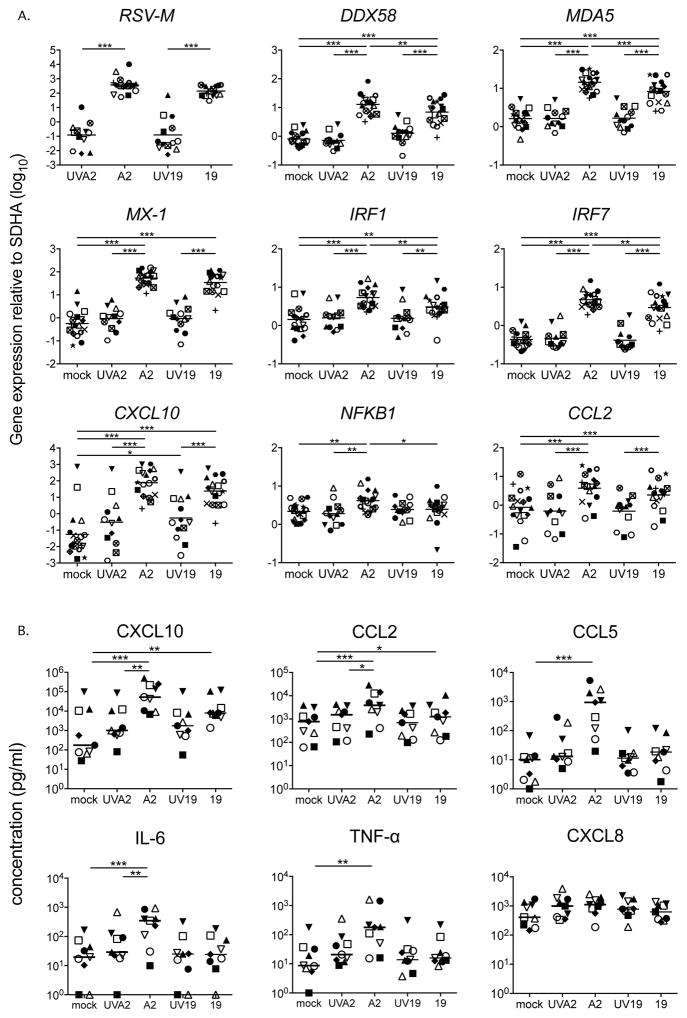
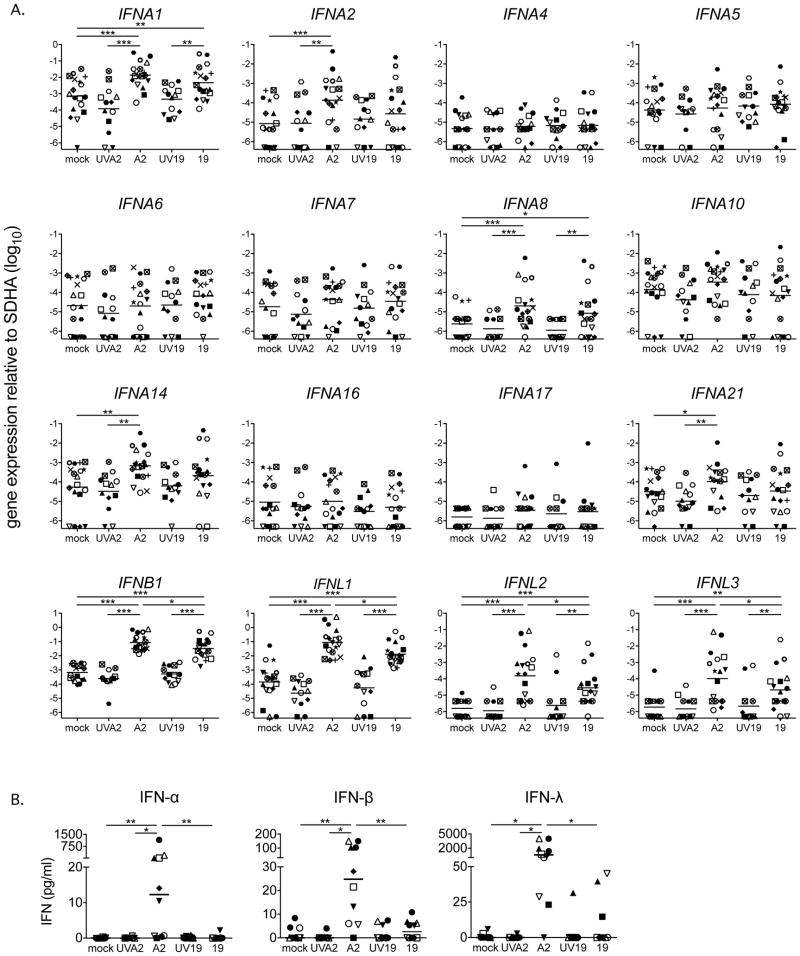
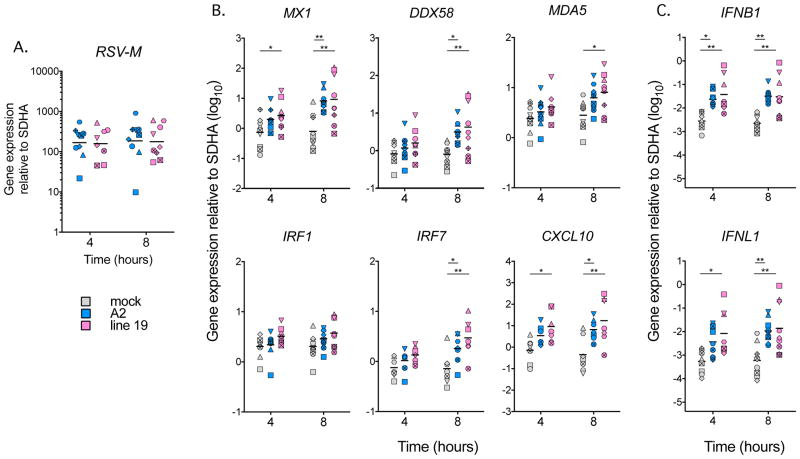
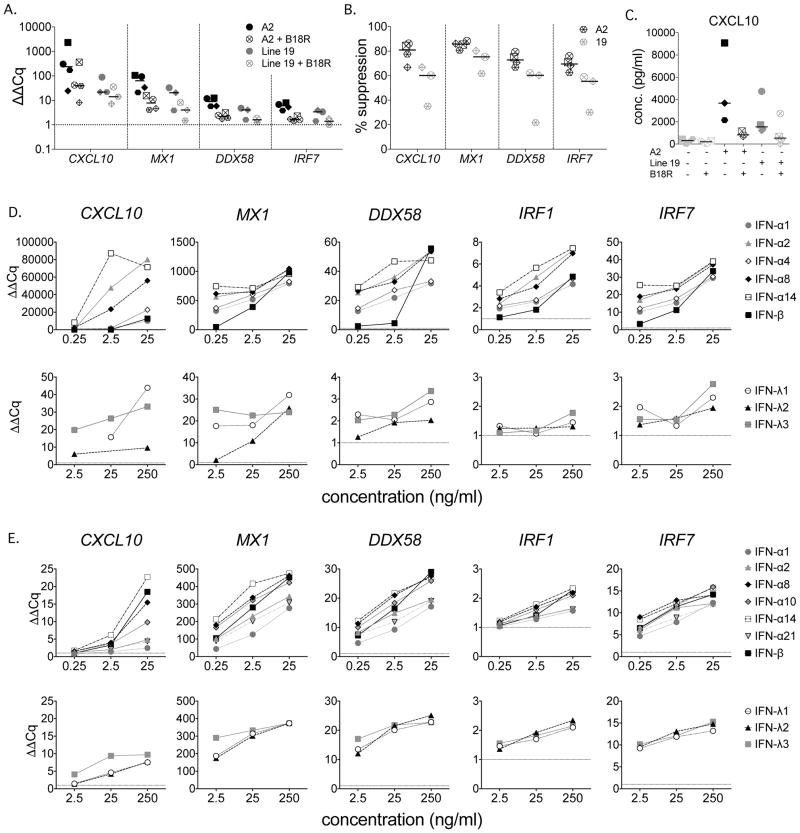
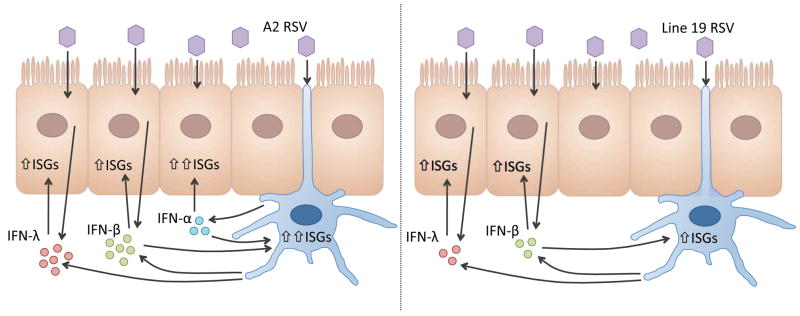
Whether respiratory syncytial virus (RSV) induces severe infantile pulmonary disease may depend on viral strain and expression of types I and III interferons (IFNs). These IFNs impact disease severity by inducing expression of many anti-viral IFN-stimulated genes (ISGs). To investigate the impact of RSV strain on IFN and ISG expression, we stimulated human monocyte-derived DCs (MDDCs) with either RSV A2 or Line 19 and measured expression of types I and III IFNs and ISGs. At 24h, A2 elicited higher ISG expression than Line 19. Both strains induced MDDCs to express genes for IFN-β, IFN-α1, IFN-α8, and IFN-λ1-3, but only A2 induced IFN-α2, -α14 and -α21. We then show that IFN-α8 and IFN-α14 most potently induced MDDCs and bronchial epithelial cells (BECs) to express ISGs. Our findings demonstrate that RSV strain may impact patterns of types I and III IFN expression and the magnitude of the ISG response by DCs and BECs.

Keywords: Bronchial epithelial cell; Dendritic cell; Innate immunity; Interferon; Interferon stimulated gene; Interferon subtype; Respiratory syncytial virus.


Figures

Figure 1
Figure 1. At 24 hours, innate immune gene expression is higher in response to A2 than Line 19
MDDCs from three donors were infected with either live or UV-inactivated RSV strain A2 or Line 19 (MOI = 3) for 24h. Gene expression was measured by qRT-PCR using a TLR pathway gene array. Data are expressed as mean fold change from mock-infected cells normalized to GAPDH. A. Live A2 and live Line 19 induce expression of similar genes, but live A2 induces higher expression of some TLR pathway genes in MDDCs compared to live Line 19. Each point represents one gene of 84 examined, and shows the mean of the data for the three donors. Genes upregulated > 2.5 fold by RSV infection (either strain) are labeled, diagonal lines represent 2.5 fold change in gene expression between the two strains of RSV examined, specific genes expressed > 2.5 fold higher in response to A2 compared to Line 19 are indicated as filled circles. B. Live virus is required to induce gene expression. Data shown are from the same three donors in response to live A2 or Line 19, or UV-inactivated A2 or Line 19. Each individual donor is represented by a different symbol. The dotted line represents gene expression in mock-infected cells.
Figure 2
Figure 2. At 24 hours, expression of ISGs and inflammatory cytokines are higher in A2 compared to Line 19 infected MDDCs
MDDCs from 18 donors were infected with either live or UV-inactivated RSV A2 or Line 19 (MOI = 3) for 24h. A. Gene expression by MDDCs from all 18 donors (UV-A2 12 donors, UV-Line 19 13 donors) was quantified by real time PCR. Gene expression was calculated relative to the housekeeping gene SDHA and is plotted on a log10 scale. Each shape represents one donor. All p values were calculated using a mixed effects model (see methods for further details). Adjusted p values * p < 0.05, ** p < 0.01, *** p < 0.001. B. Cytokines and chemokines were quantified by multiplex bead assay in 9 of 18 donors. Each shape represents one donor. Horizontal line indicates the median. Statistical differences were determined by Friedman test with Dunn’s multiple comparison test. * p < 0.05, ** p < 0.01, *** p < 0.001.
Figure 3
Figure 3. At 24 hours, RSV induces expression of a subset of type I and III IFNs
A. IFN subtype expression by MDDCs from 18 donors after exposure to A2 or Line 19 was quantified using a qRT-PCR assay that discriminates among each of the twelve unique subtypes of IFN-α and detects IFN-β and the three IFN-λ subtype genes. Expression of IFNA1, IFNA8, IFNB1, IFNL1, IFNL2 and IFNL3 was increased in response to both RSV strains. IFNA2, IFNA14 and IFNA21 were significantly increased in response to A2, and in many donors, in response to Line 19. Gene expression was calculated relative to SDHA and is shown on a log10 scale. Each shape represents one donor. Mock, A2, line 19, n=18, UVA2 and UV19 n=13. Statistical differences were calculated using a mixed effects model (see methods for further details). Adjusted p values * p < 0.05, ** p < 0.01, *** p < 0.001. B. The levels of type I and III IFNs were measured by ELISA. RSV strain A2, but not Line 19 induced IFN-α, -β and -λ expression. Each shape represents one donor. Horizontal line indicates the median. All statistical differences were determined by Friedman test with Dunn’s multiple comparison test. * p < 0.05, ** p < 0.01.
Figure 4
Figure 4. The kinetics of RSV-M, ISG and IFN expression differ dependent on RSV strain
MDDCs from nine donors (eight donors at 4 hpi and 24 hpi Line 19) were exposed to live virus of each strain (MOI = 3) for 4, 8 or 24 hours and the RNA harvested. qRT-PCR was used to measure gene expression over time relative to SDHA. Each shape represents a different donor. Data are shown on a log10 scale. A. RSV-M, B. ISG, C. IFNB1 and IFNL1 expression. Statistical differences were calculated using a mixed effects model at 4h and 8h as shown * p < 0.05, ** p < 0.01, *** p < 0.001 (see methods for further details).
Figure 5
Figure 5. Type I IFNs are the major inducers of ISGs by MDDCs
A – C. MDDCs from four donors were stimulated with live RSV of each strain (MOI = 3) for 24 hours in the presence or absence of B18R, a vaccinia virus encoded soluble type I IFN receptor. Gene expression was measured by qRT-PCR. Data were normalized to SDHA and expressed as ΔΔCq (fold change) compared to unstimulated MDDCs (A), or as percent suppression in the presence of B18R compared to RSV alone (B). A2 n=4, Line 19, n=3. CXCL10 protein expression was quantified by multiplex bead assay (C). RSV A2 n=3, Line 19 n=4. D-E. MDDCs and BEAS-2B cells were stimulated with the indicated levels of each IFN for 24 hours and gene expression measured by qRT-PCR. The dotted horizontal line indicates expression in unstimulated cultures. D. MDDCs, Data were normalized to SDHA and expressed as ΔΔCq (fold change) compared to unstimulated MDDCs. Data shown is one representative donor of four analyzed. E. BEAS-2B cells, data were normalized to GAPDH and expressed as ΔΔCq (fold change) compared to unstimulated BEAS-2B cells. Data shown is one representative experiment of two analyzed.
Figure 6
Figure 6. Strain dependent IFN expression by DCs
RSV A2 (left panel) induces DCs to express high levels of IFN-β and IFN-λ1, and to express three IFN-α subtypes: IFN-α2, -α8, and -α14. These IFNs induce high expression of ISGs by DCs with a generalized hierarchy of IFN-α14 > -α2 > -α8 > -β and by bronchial epithelial cells with a hierarchy of IFN-α14 > -α8 > -β > -λ3 > -λ1, -λ2 and -α2. In contrast, RSV line 19 induces lower expression of IFN-β and −λ1, and IFN-α1, which may not be optimal for inducing an antiviral response in the epithelial cells, or for the DCs to mediate an appropriate adaptive response.

References

    1. Barik S. Respiratory syncytial virus mechanisms to interfere with type 1 interferons. Current topics in microbiology and immunology. 2013;372:173–191. - PubMed
    1. Bartz H, Turkel O, Hoffjan S, Rothoeft T, Gonschorek A, Schauer U. Respiratory syncytial virus decreases the capacity of myeloid dendritic cells to induce interferon-gamma in naive T cells. Immunology. 2003;109:49–57. - PMC - PubMed
    1. Benjamini Y, Hochberg Y. Controlling the false discovery rate: a practical and powerful approach to multiple testing. Journal of the royal statistical society. Series B (Methodological) 1995:289–300.
    1. Bolen CR, Ding S, Robek MD, Kleinstein SH. Dynamic expression profiling of type I and type III interferon-stimulated hepatocytes reveals a stable hierarchy of gene expression. Hepatology. 2014;59:1262–1272. - PMC - PubMed
    1. Chanock R, Roizman B, Myers R. Recovery from infants with respiratory illness of a virus related to chimpanzee coryza agent (CCA). I. Isolation, properties and characterization. Am J Hyg. 1957;66:281–290. - PubMed

MeSH terms