. 2017 Mar 28;8(13):20706-20718.
doi: 10.18632/oncotarget.14982.

Metformin-treated cancer cells modulate macrophage polarization through AMPK-NF-κB signaling

Affiliations

Metformin-treated cancer cells modulate macrophage polarization through AMPK-NF-κB signaling

Chi-Fu Chiang et al. Oncotarget. .

Abstract

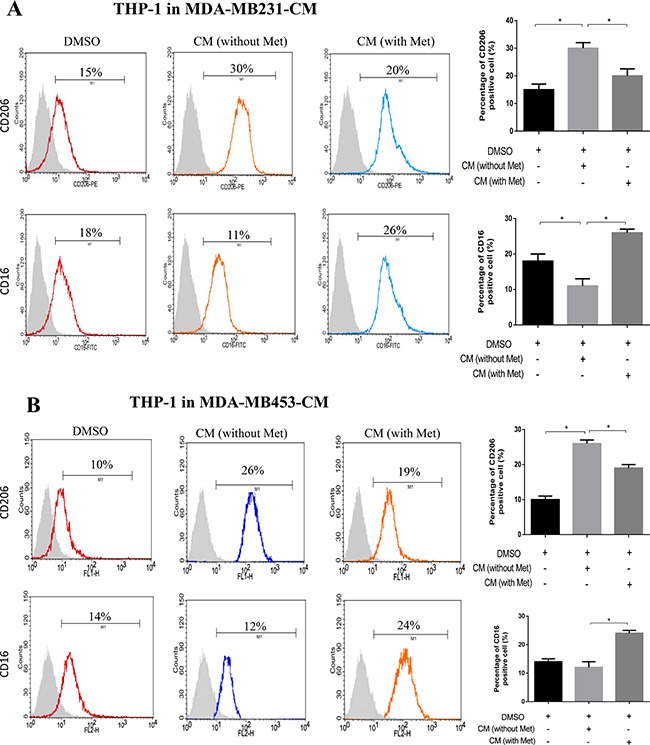
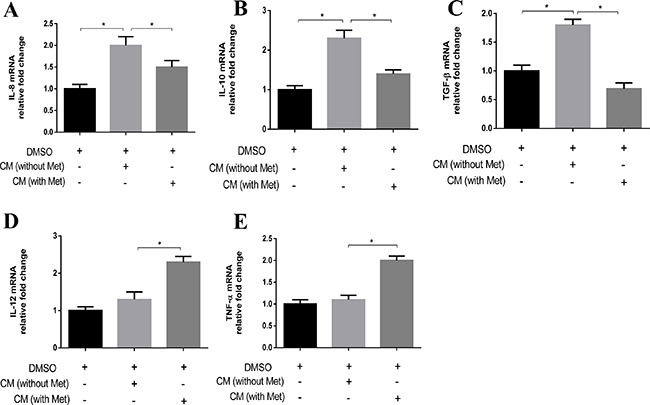
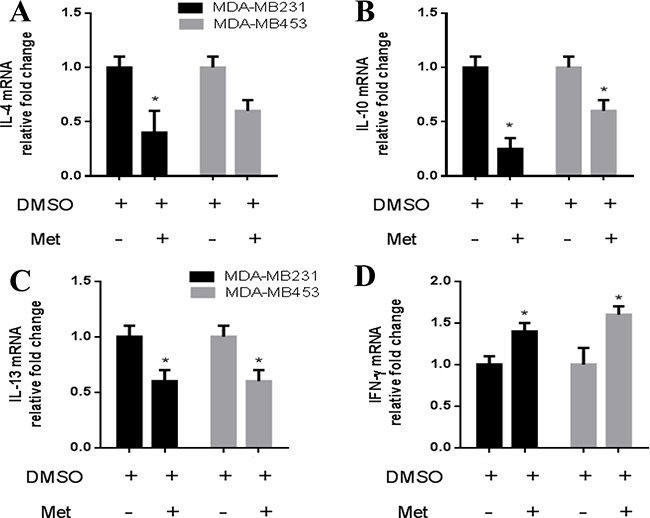
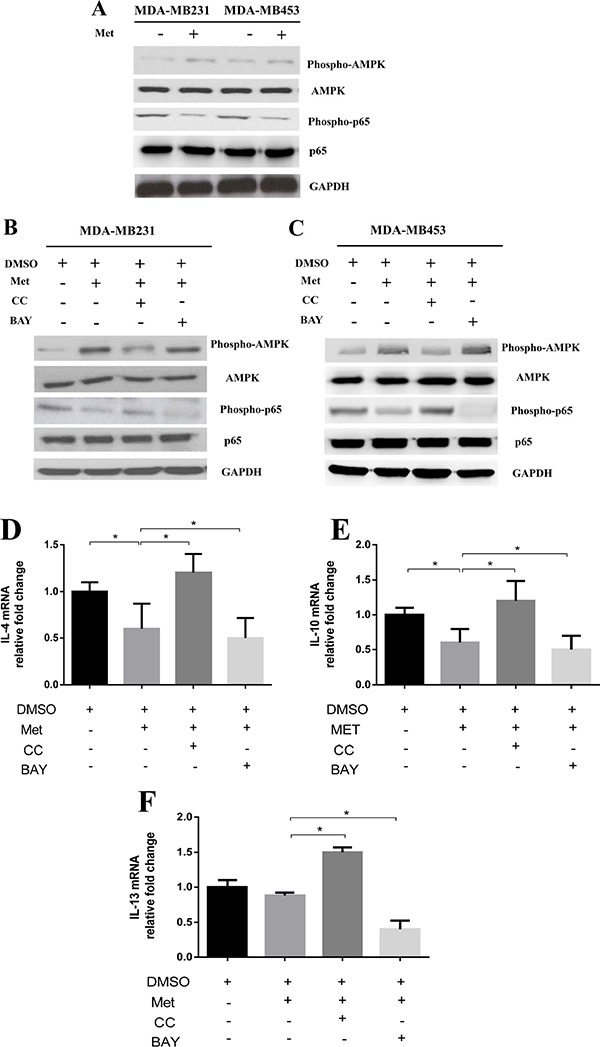
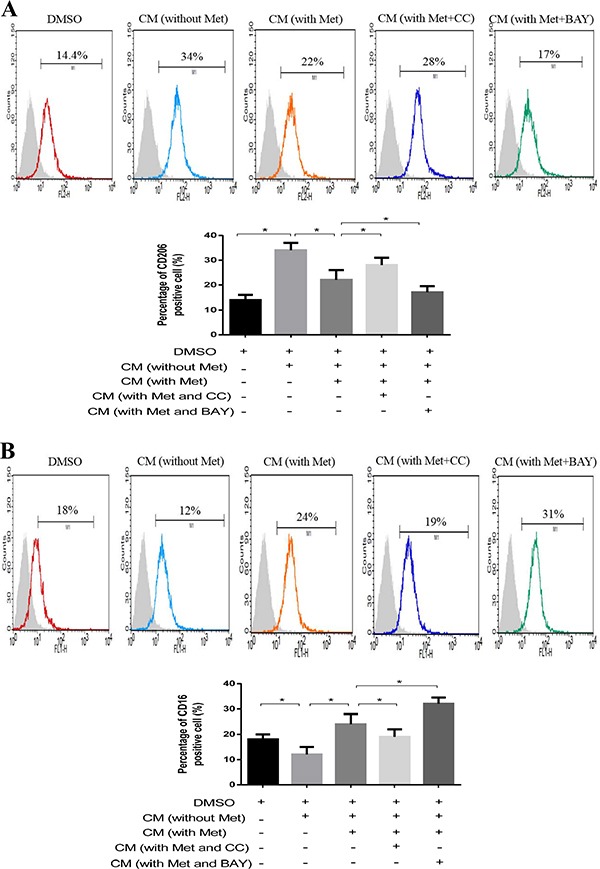
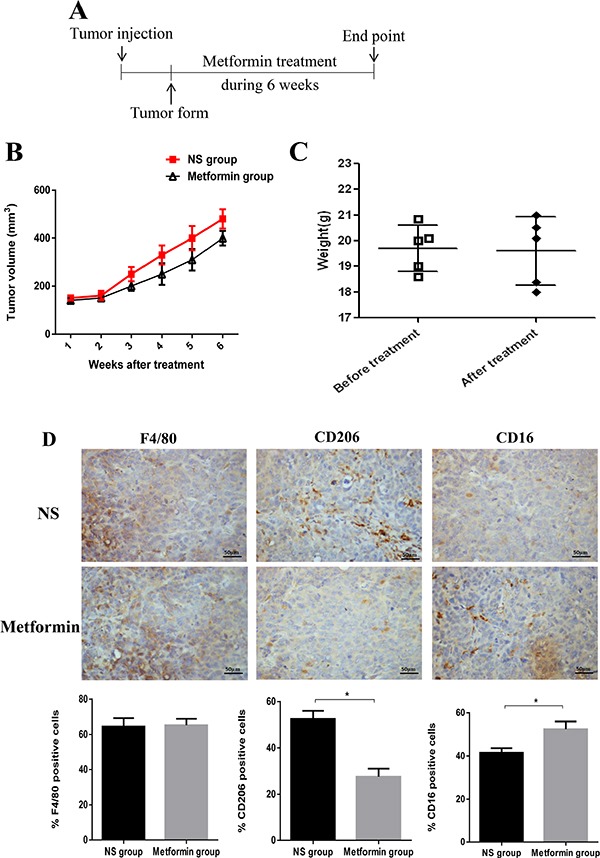
Accumulating evidence is indicating metformin to possess the potential ability in preventing tumor development and suppressing cancer growth. However, the exact mechanism of its antitumorigenic effects is still not clear. We found that metformin suppressed the ability of cancer to skew macrophage toward M2 phenotype. Metformin treated cancer cells increased macrophage expression of M1-related cytokines IL-12 and TNF-α and attenuated M2-related cytokines IL-8, IL-10, and TGF-β expression. Furthermore, metformin treated cancer cells displayed inhibited secretion of IL-4, IL-10 and IL-13; cytokines important for inducing M2 macrophages. Conversely, M1 inducing cytokine IFN-γ was upper-regulated in cancer cells. Additionally, through increasing AMPK and p65 phosphorylation, metformin treatment activated AMPK-NF-κB signaling of cancer cells that participate in regulating M1 and M2 inducing cytokines expression. Moreover, Compound C, an AMPK inhibitor, significantly increased IL-4, IL-10, and IL-13 expression while BAY-117082, an NF-κB inhibitor, decreased expression. In metformin-treated tumor tissue, the percentage of M2-like macrophages decreased while M1-like macrophages increased. These findings suggest that metformin activates cancer AMPK-NF-κB signaling, a pathway involved in regulating M1/M2 expression and inducing genes for macrophage polarization to anti-tumor phenotype.

Keywords: NF-κB; breast cancer; macrophage polarization; metformin; microenvironment.


Conflict of interest statement

CONFLICTS OF INTEREST

The authors declare no conflicts of interest.

Figures

Figure 1
Figure 1. Metformin treated cancer cells polarized macrophage toward M1 phenotype
THP-1 cells were stimulated with PMA (200 nM) for 24 h, then incubated with breast cancer (MDA-MB231/MDA-MB453) conditioned medium (CM) with or without metformin (60 μM) for 6 h, followed by flow cytometry analysis to quantify the amount of CD206, an M2 macrophage marker, and CD16, an M1 marker (A, B). Data are expressed as mean ± SD, *p < 0.05. DMSO: control; Met: metformin. Representative flow data shown are from experiments independently performed at least three times.
Figure 2
Figure 2. Metformin treated cancer cells increased M1 cytokine and decreased M2 cytokine expression in macrophage
THP-1 cells were stimulated with PMA (200 nM) for 24 h, then incubated with breast cancer conditioned medium (CM) with or without metformin (60 μM) for 6 h, followed by analysis of the secretion of IL-8, IL-10, TGF-β, IL-12 and TNF-α using quantitative PCR (A–E). Data are expressed as mean ± SD, *p < 0.05. DMSO: control; Met: metformin. Representative quantitative PCR data shown are from experiments independently performed at least three times.
Figure 3
Figure 3. Metformin decreased IL-4, IL-10, IL-13 and increased IFN-γ expression in breast cancer cells
Breast cancer cells (MDA-MB231/MDA-MB453) were treated with metformin (60 μM) for 6 h, followed by analysis of the secretion of IL-4, IL-10, IL-13 and IFN-γ using quantitative PCR (AD). Data are expressed as mean ± SD, *p < 0.05. DMSO: control; Met: metformin. Representative quantitative PCR data shown are from experiments independently performed at least three times.
Figure 4
Figure 4. Metformin treatment activated AMPK and inhibited NF-κB signaling in cancer cells
Breast cancer cells (MDA-MB231/MDA-MB453) were treated with metformin 60 μM for 6 h. The protein lysates were subjected to SDS-PAGE followed by immunoblotting with antibodies against phospho-AMPK, AMPK, phospho-p65, p65 and GAPDH (A). Breast cancer cells (MDA-MB231/MDA-MB453) were treated with metformin 60 μM combined with an AMPK inhibitor (Compound C, CC) or NF-κB inhibitor (BAY-117082, BAY) for 6 h. The protein lysates were subjected to SDS-PAGE followed by immunoblotting with antibodies against phospho-AMPK, AMPK, phospho-p65, p65 and GAPDH (B, C). The addition of the Compound C or BAY-117082 to metformin-treated cells and the secretion of IL-4, IL-10 and IL-13 from the breast cancer cells were assayed by quantitative PCR (D, E, F). Data are expressed as mean ± SD, *p < 0.05. DMSO: control; Met: metformin. Representative quantitative PCR data shown are from experiments independently performed at least three times.
Figure 5
Figure 5. AMPK-NF-κB signaling participated in macrophage polarization
Breast cancer cells (MDA-MB231) were treated with metformin 60 μM combined with an AMPK inhibitor (Compound C, CC) or NF-κB inhibitor (BAY-117082, BAY) for 6 h. The supernatant was collected to treat macrophages for 48 h, followed by flow cytometry analysis of CD206, M2 phenotype (A) and CD16, M1 phenotype (B). Data are expressed as mean ± SD, *p < 0.05. DMSO: control; CM: conditioned medium, Met: metformin. Representative flow data shown are from experiments independently performed at least three times.
Figure 6
Figure 6. Administration of metformin affected tumor growth and TAM polarization in a xenograft model
Schematic diagram of the experimental process in the xenograft model (A). The tumor volumes were determined (B). The weights of the mice were measured in all groups before and after metformin treatment (C). The tumor tissues were removed and subjected to immunohistochemistry (IHC) analysis. The infiltrated macrophages were analyzed for overall macrophage marker F4/80, M1 marker CD16, and M2 marker CD206, and the quantified data is shown. Scale bar 50 μm (D). Data are expressed as mean ± SD, *p < 0.05. NS: normal saline. Representative data are shown from experiments independently performed at least three times.

References

    1. Chowdhury TA. Diabetes and cancer. QJM: monthly journal of the Association of Physicians. 2010;103:905–915. - PubMed
    1. Place AE, Jin Huh S, Polyak K. The microenvironment in breast cancer progression: biology and implications for treatment. Breast Cancer Res. 2011;13:227. - PMC - PubMed
    1. Fiaschi T, Chiarugi P. Oxidative stress, tumor microenvironment, and metabolic reprogramming: a diabolic liaison. Int J Cell Biol. 2012;2012:762825. - PMC - PubMed
    1. Ding L, Liang G, Yao Z, Zhang J, Liu R, Chen H, Zhou Y, Wu H, Yang B, He Q. Metformin prevents cancer metastasis by inhibiting M2-like polarization of tumor associated macrophages. Oncotarget. 2015;6:36441–36455. doi: 10.18632/oncotarget.5541. - DOI - PMC - PubMed
    1. Mukhtar RA, Nseyo O, Campbell MJ, Esserman LJ. Tumor-associated macrophages in breast cancer as potential biomarkers for new treatments and diagnostics. Expert Rev Mol Diagn. 2011;11:91–100. - PubMed

MeSH terms

LinkOut - more resources