. 2017 Feb 3;13(2):e1005285.
doi: 10.1371/journal.pcbi.1005285. eCollection 2017 Feb.

Dynamic Maternal Gradients Control Timing and Shift-Rates for Drosophila Gap Gene Expression

Affiliations

Dynamic Maternal Gradients Control Timing and Shift-Rates for Drosophila Gap Gene Expression

Berta Verd et al. PLoS Comput Biol. .

Erratum in

Abstract

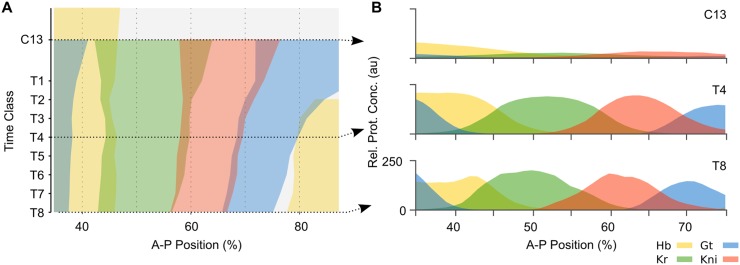
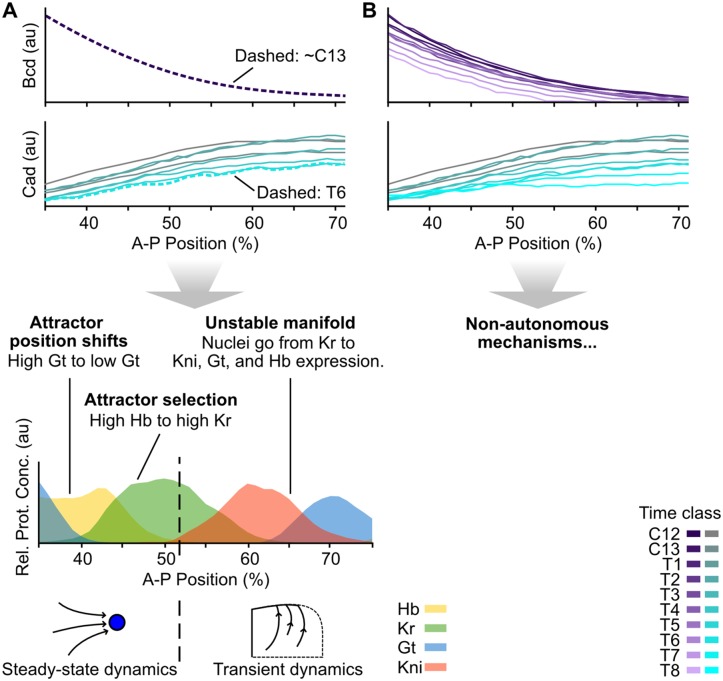
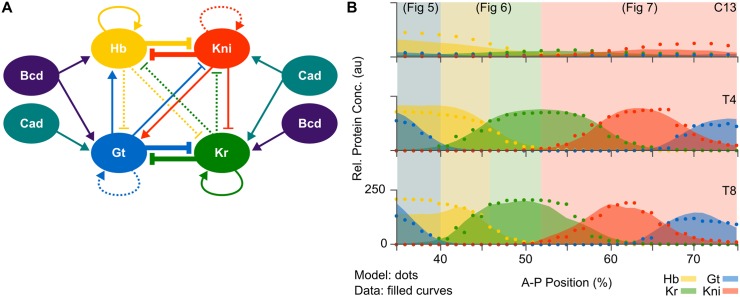
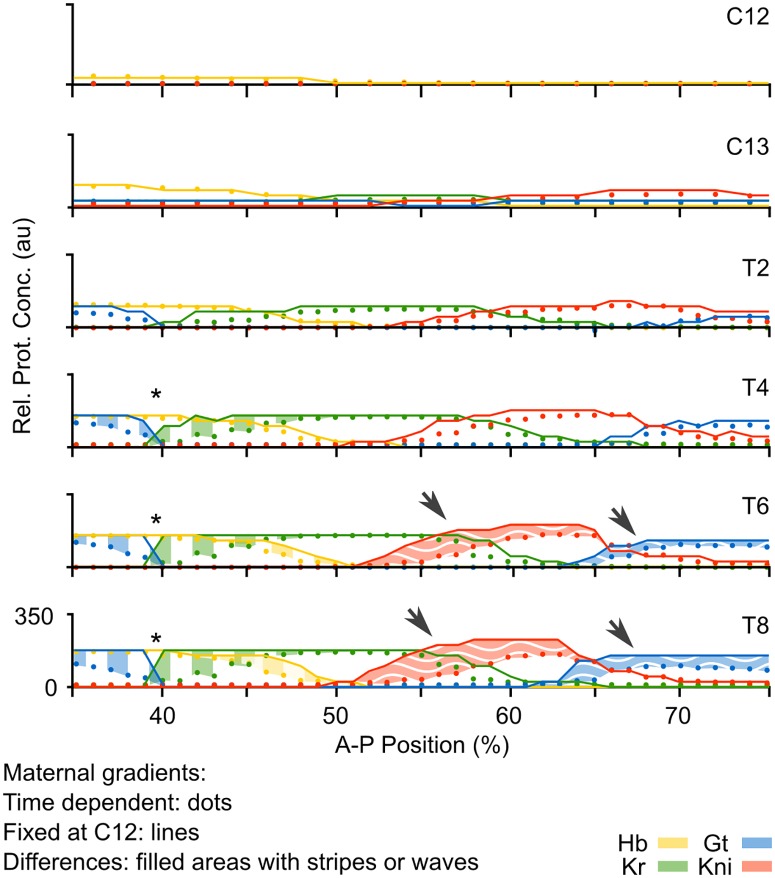
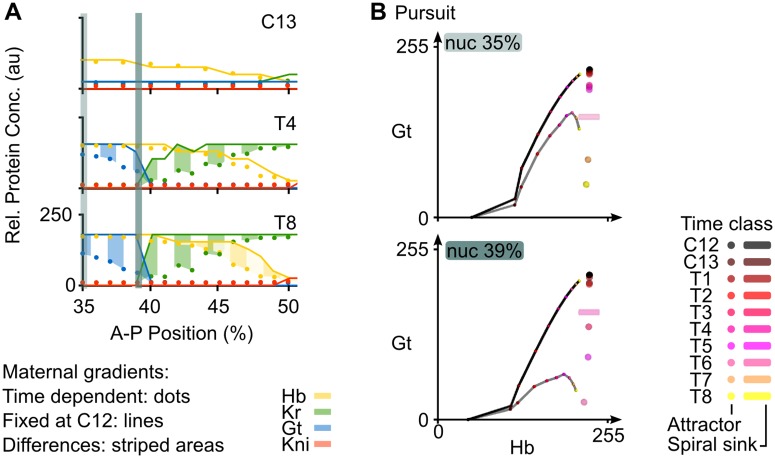
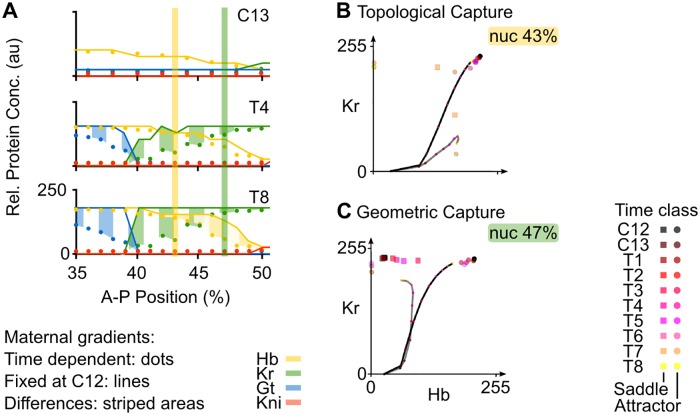
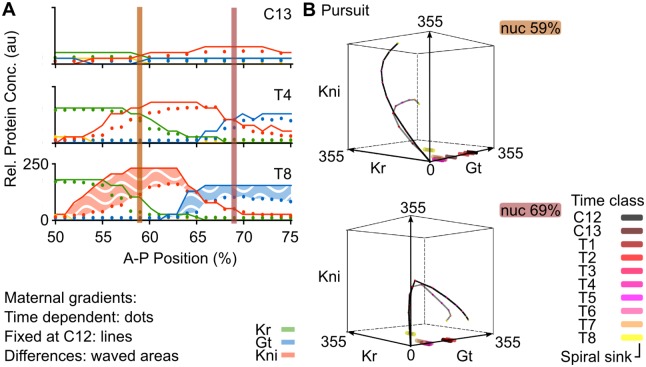
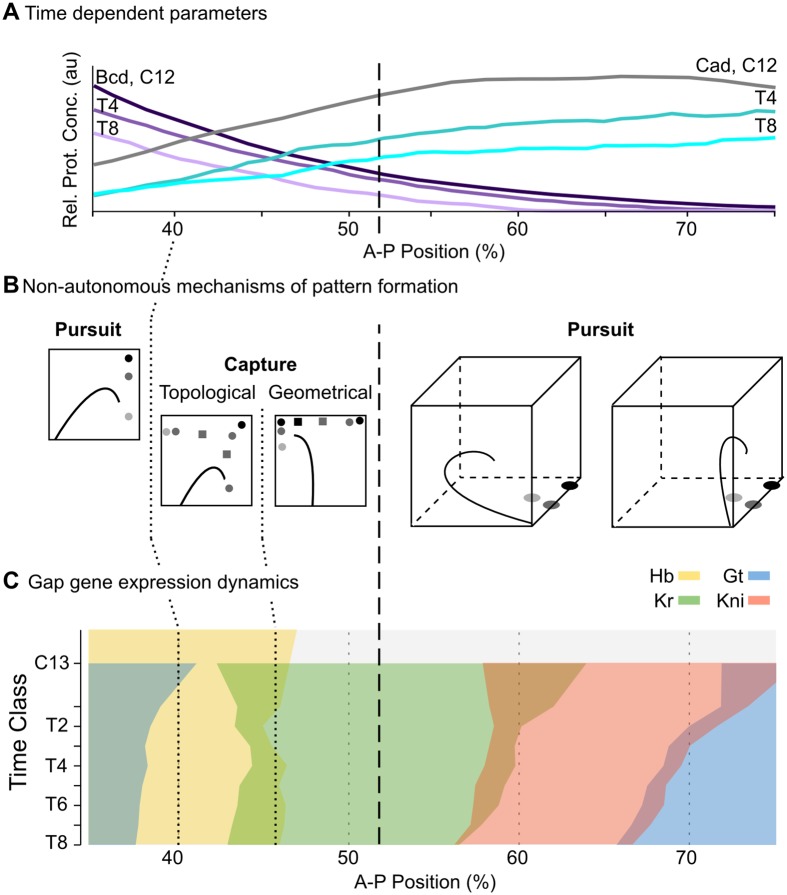
Pattern formation during development is a highly dynamic process. In spite of this, few experimental and modelling approaches take into account the explicit time-dependence of the rules governing regulatory systems. We address this problem by studying dynamic morphogen interpretation by the gap gene network in Drosophila melanogaster. Gap genes are involved in segment determination during early embryogenesis. They are activated by maternal morphogen gradients encoded by bicoid (bcd) and caudal (cad). These gradients decay at the same time-scale as the establishment of the antero-posterior gap gene pattern. We use a reverse-engineering approach, based on data-driven regulatory models called gene circuits, to isolate and characterise the explicitly time-dependent effects of changing morphogen concentrations on gap gene regulation. To achieve this, we simulate the system in the presence and absence of dynamic gradient decay. Comparison between these simulations reveals that maternal morphogen decay controls the timing and limits the rate of gap gene expression. In the anterior of the embyro, it affects peak expression and leads to the establishment of smooth spatial boundaries between gap domains. In the posterior of the embryo, it causes a progressive slow-down in the rate of gap domain shifts, which is necessary to correctly position domain boundaries and to stabilise the spatial gap gene expression pattern. We use a newly developed method for the analysis of transient dynamics in non-autonomous (time-variable) systems to understand the regulatory causes of these effects. By providing a rigorous mechanistic explanation for the role of maternal gradient decay in gap gene regulation, our study demonstrates that such analyses are feasible and reveal important aspects of dynamic gene regulation which would have been missed by a traditional steady-state approach. More generally, it highlights the importance of transient dynamics for understanding complex regulatory processes in development.


Conflict of interest statement

The authors have declared that no competing interests exist.

Figures

Fig 1
Fig 1. Dynamics of gap gene expression.
(A) Space-time plot of protein expression data for the trunk gap genes during the late blastoderm stage in D. melanogaster. Coloured areas demarcate regions with relative protein concentration above half-maximum value. Time flows downwards along the y-axis. (B) Cross-sections of gene expression in (A) at cycle C13 and time classes C14A-T4 and T8 (dashed arrows in (A)). Y-axes indicate relative protein concentration in arbitrary units (au). In both panels, x-axes represent %A–P position, where 0% is the anterior pole. Hunchback (Hb) is shown in yellow, Krüppel (Kr) in green, Knirps (Kni) in red, and Giant (Gt) in blue. C13: cleavage cycle 13; C14A-T1–8: cleavage cycle 14A, time classes 1–8 (see Models and Methods for details).
Fig 2
Fig 2. Static-Bcd versus non-autonomous gap gene patterning mechanisms.
(A) Summary of the phase space analysis of the Static-Bcd gap gene circuit in D. melanogaster by Manu et. al. [23]. An exponential function fit to the Bcd profile at cycle C13 was used to calculate trajectories and phase portraits. All Cad profiles until time class T6 were considered for simulating trajectories, but phase portraits were calculated using the profile at T6 only. This gene circuit displays the following mechanisms for boundary formation: patterning between 35–51% A–P position takes place in a multi-stable regime close to steady state. The Gt boundary is established as the relevant attractor moves from high to low Gt concentration in more posterior nuclei. The Hb-Kr interface forms as the maternal Hb gradient places more anterior nuclei in the basin of an attractor with high Hb concentration, and more posterior nuclei in the basin of an attractor at high Kr concentration. Between 51 and 53% A–P position a saddle-node bifurcation takes place, and the dynamics become transient in nuclei posterior of 52%. These nuclei are all in the basin of the same attractor and approach it by first converging towards an unstable manifold. Anterior shifts in these posterior gap gene domains emerge from a coordinated succession of trajectories in more posterior nuclei approaching the unstable manifold. See [23] for details. (B) In the non-autonomous gap gene circuit analysed here, Bcd and Cad gradient profiles are included for every time point. They are used to calculate trajectories of the system and instantaneous phase portraits as discussed in the main text. Plots in (A) and (B) show % A–P position along the x-axes, and protein concentrations (in arbitrary units, au) along the y-axes as in Fig 1B).
Fig 3
Fig 3. Non-autonomous gap gene circuits.
(A) Regulatory structure derived from previously published non-autonomous gap gene circuits with diffusion [26]. Connecting arrows and T-bars represent activating and repressive interactions, respectively. Line thickness indicates an interaction’s relative strength, with very weak interactions dashed. (B) Model output of a fully non-autonomous gene circuit without diffusion (dots) and gap protein data (filled curves) at three time points: C13 (early), T4 (mid), and T8 (late blastoderm stage). The x-axis represents %A–P position, where 0% is the anterior pole. The y-axis represents relative protein concentration in arbitrary units (au). Coloured background areas indicate different dynamic patterning mechanisms that are shown in detail in Figs 5–7.
Fig 4
Fig 4. Effect of the time-dependence of maternal gradients on gap gene pattern formation.
(A) Plots show output from the non-autonomous gap gene circuit with time-variable maternal gradients (dots), compared to output from the same model with maternal gradients fixed to their values at cycle C12 (early blastoderm stage; lines). Y-axes represent relative protein concentrations in arbitrary units (au); x-axes represents %A–P position, where 0% is the anterior pole. Differences between the two model simulations are shaded using vertical stripes in the anterior trunk region, and wavy horizontal stripes in the posterior. Asterisks mark over-expression in the region of the Gt/Kr interface; arrows mark “overshoot” of gap domain shifts in the posterior of the embryo.
Fig 5
Fig 5. Positioning the posterior boundary of the anterior Gt domain.
(A) Output of the non-autonomous gene circuit (dots) versus the same model without maternal gradient decay (lines) shown at cleavage cycle C13 and C14A (time classes T4 and T8) for nuclei within 35–52% A–P position. Axes and colouring scheme as in Fig 3B. Blue vertical bars mark the nuclei at 35% and 39%A–P position shown in (B). (B) Phase portraits for nuclei at 35% (top) and 39%A–P position (bottom). Phase portraits are shown as two-dimensional projections onto the plane defined by Hb (x-axis) and Gt (y-axis) concentrations (in arbitrary units, au). Non-autonomous trajectories shown as grey lines and autonomous trajectories as black lines. Attractors shown as spheres (point attractors) and cylinders (indicating a spiral sink). Small coloured dots on trajectories indicate the position in space of that trajectory at different time points. Colouring of attractors and trajectory positions indicates time class (see key). Other steady states have been omitted for clarity, since they do not shape the trajectories in these nuclei. See text for details.
Fig 6
Fig 6. Positioning the Hb-Kr interface.
Output of the non-autonomous gene circuit (dots) versus the same model without maternal gradient decay (lines) shown at cleavage cycle C13 and C14A (time classes T4 and T8) for nuclei between 35–52% A–P position. Axes and colouring scheme as in Fig 3B. Yellow and green vertical bars mark the nuclei at 43% and 47%A–P position shown in (B) and (C) respectively. (B) Phase portrait for nucleus at 43% position. (C) Phase portrait for nucleus at 47% position. Phase portraits are shown as two-dimensional projections onto the plane defined by Hb (x-axis) and Kr (y-axis) concentrations (in arbitrary units, au). Non-autonomous trajectories are shown as grey lines and autonomous trajectories, as black lines. Point attractors are represented by spheres and saddles points by squares. Small coloured dots on the trajectories indicate the position in phase space (Hb and Kr concentrations) of the trajectory at different time points. Colouring of attractors and trajectory positions indicates time class (see key). Other steady states have been omitted for clarity, since they do not shape trajectories in these nuclei. See text for details.
Fig 7
Fig 7. Regulating the extent and timing of posterior gap domain shifts.
(A) Output of the non-autonomous gene circuit (dots) versus the same model without maternal gradient decay (lines) shown at cleavage cycle C13 and C14A (time classes T4 and T8) for nuclei between 50–75% A–P position. Axes and colouring scheme as in Fig 3B. Red vertical bars mark the nuclei at 59% and 69%A–P position shown in (B). (B) Phase portraits for nuclei at 59% (top) and 69%A–P position (bottom). Phase portraits are shown as three-dimensional projections onto the sub-space defined by Kr (x-axis), Gt (y-axis) and Kni (z-axis) concentrations (in arbitrary units, au). Non-autonomous trajectories shown as grey lines and autonomous trajectories as black lines. Spiral sinks are represented by cylinders. Small coloured dots on trajectories indicate the position in phase space of the trajectory at different time points. Colouring of attractors and trajectory positions indicates time class (see key). See text for details.
Fig 8
Fig 8. Summary of non-autonomous mechanisms for gap gene pattern formation in D. melanogaster.
(A) Non-autonomous gap gene circuits implement realistic, time-dependent dynamics of maternal morphogen gradients (Bcd in purple, Cad in cyan). Y-axis shows relative protein concentration (in arbitrary units, au); X-axis shows %A–P position, where 0% is the anterior pole. (B) Different non-autonomous mechanisms of pattern formation are active at different positions along the A–P axis of the embryo. Stylized projections of phase space are shown. See S1B Fig and [43] for nomenclature. (C) Gap gene expression dynamics differ between the anterior and the posterior regions of the embryo. While domain boundaries in the anterior are stationary, boundaries in the posterior shift towards the anterior over time. Time-space plot as in Fig 1A: note that time flows downward along the y-axis (cycle C13 and time classes T1–8 as defined in Models and Methods). The dashed vertical line spanning all panels indicates a bifurcation event at 52% A–P position, which separates the multi-stable from the oscillatory regime.

Similar articles

Cited by

References

    1. Kashtan N, Alon U. Spontaneous evolution of modularity and network motifs. Proceedings of the National Academy of Sciences of the United States of America. 2005;102:13773–13778. 10.1073/pnas.0503610102 - DOI - PMC - PubMed
    1. Liu J, Ma J. Modulation of temporal dynamics of gene transcription by activator potency in the Drosophila embryo. Development. 2015; 142(21):3781–3790. 10.1242/dev.126946 - DOI - PMC - PubMed
    1. Kashtan N, Noor E, Alon U. Varying environments can speed up evolution. Proceedings of the National Academy of Sciences. 2007;104:13711–13716. 10.1073/pnas.0611630104 - DOI - PMC - PubMed
    1. Crombach A, Hogeweg P. Evolution of evolvability in gene regulatory networks. PLoS computational biology. 2008; 4: e1000112 10.1371/journal.pcbi.1000112 - DOI - PMC - PubMed
    1. Crombach A, Hogeweg P. Evolution of resource cycling in ecosystems and individuals. BMC evolutionary biology. 2009; 9:122 10.1186/1471-2148-9-122 - DOI - PMC - PubMed

MeSH terms