

doi: 10.1093/jxb/erx014.
Kiwifruit SVP2 gene prevents premature budbreak during dormancy
Affiliations
- PMID: 28158721
- PMCID: PMC5853213
- DOI: 10.1093/jxb/erx014
Item in Clipboard
Kiwifruit SVP2 gene prevents premature budbreak during dormancy
J Exp Bot.
.
Abstract
Overexpression of SVP2 in kiwifruit delays budbreak before sufficient winter chilling. SVP2-mediated vegetative growth restriction involves stress response pathways, and commonalities exist between Arabidopsis and kiwifruit SVP targets.
Keywords: ABA; Actinidia; SVP; bud dormancy; budbreak; dehydration; kiwifruit; transcriptome..
© The Author 2017. Published by Oxford University Press on behalf of the Society for Experimental Biology.
Figures
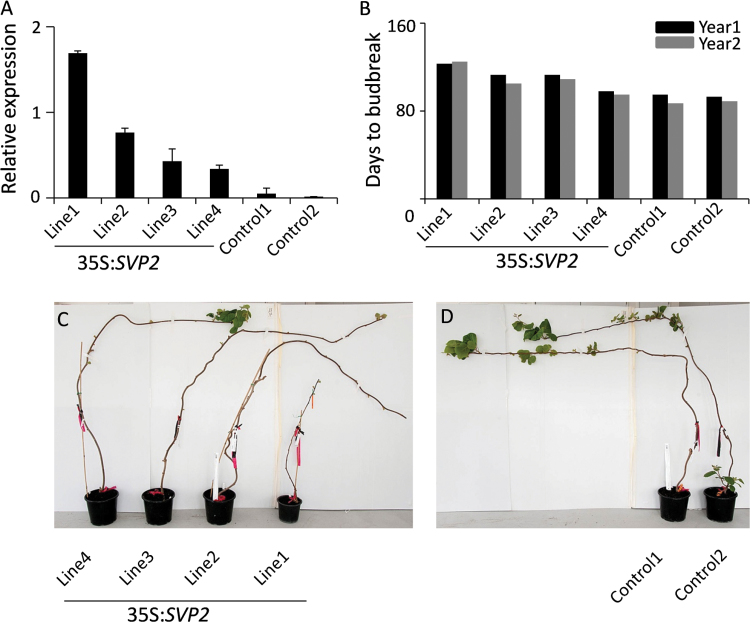
Constitutive expression of SVP2 delays budbreak in Actinidia deliciosa. (A) Relative expression of SVP2 in four 35S:SVP2 transgenic plants and two control plants. The expression was normalized to kiwifruit Actin. Error bars represent the SE of four replicate reactions. (B) Days to budbreak after 100% leaf drop in late autumn. The first visible leaf in spring was recorded as budbreak. (C, D) Transgenic A. deliciosa plants and control plants in the middle of spring.
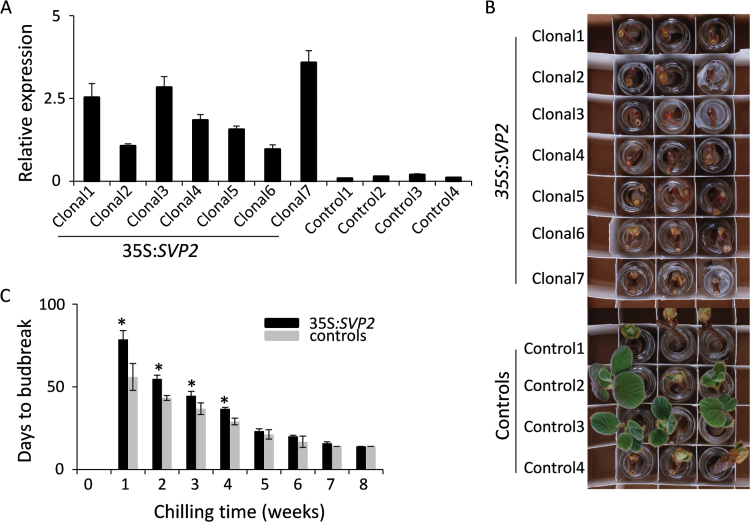
Chilling alleviates SVP2-mediated repression of budbreak. (A) Relative expression of SVP2 in clonal transgenic and control kiwifruit plants. The expression was normalized to kiwifruit Actin. Error bars represent the SE of four replicate reactions. (B) Delayed budbreak of cuttings from SVP2 transgenic plants after 3 weeks of chilling accumulation. (C) Days to budbreak were calculated as the average date of budbreak of seven clonal transgenic and four control plants. Black and grey bars denote transgenic and control plants, respectively. Error bars represent the SE of budbreak time of seven transgenic and four control plants. Asterisks indicate significantly delayed budbreak time of SVP2 plants versus controls (P<0.05; Student’s t-test).
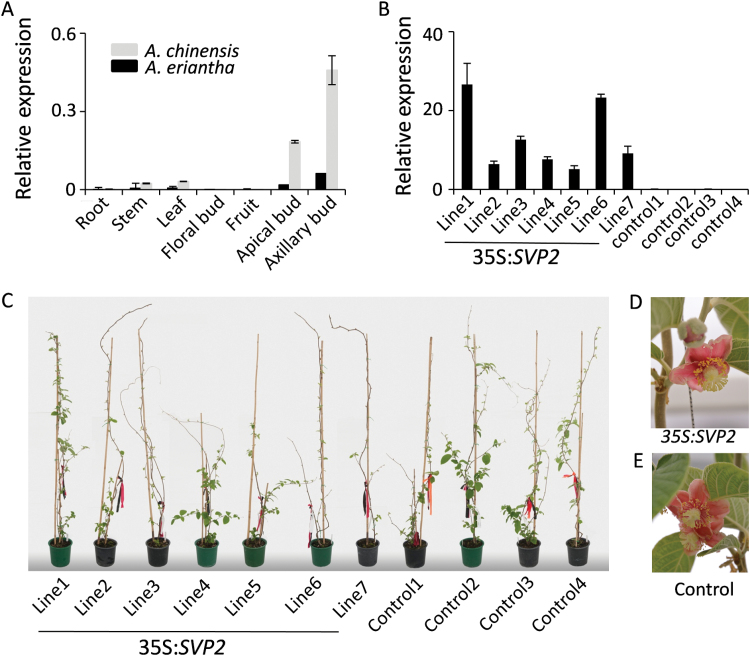
Constitutive expression of SVP2 in a low-chill kiwifruit Actinidia eriantha. (A) Relative expression of SVP2 in A. eriantha and A. chinensis tissues. The level of expression was normalized to Actin. Error bars represent SEs for three replicate reactions. (B) Relative expression of SVP2 in seven 35S:SVP2 transgenic plants and four control plants. The expression was normalized to kiwifruit Actin. Error bars represent the SE of four replicate reactions. (C) Transgenic A. eriantha plants and control plants in early spring. (D, E) Transgenic and control A. eriantha flowers.
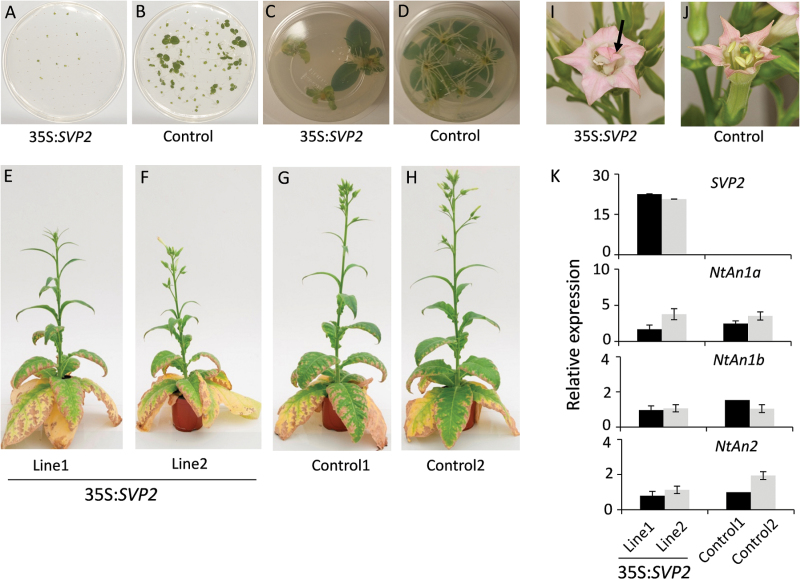
Constitutive expression of SVP2 affects vegetative development in transgenic tobacco ‘Maryland Mammoth’. (A, B) Seed germination of 35S:SVP2 plants compared with control plants, 25 d after seeds stratification on MS plates. (C, D) Slow root formation in transgenic 35S:SVP2 plants compared with control plants. (E–H) Two lines of transgenic 35S:SVP2 plants compared with control plants under SD conditions. (I, J) Mutant transgenic SVP2 flower compared with control. The arrow indicates the petaloid stamen in the transgenic flower. (K) Relative expression of NtAn1a, NtAn1b, NtAN2, and the SVP2 transgene in petals of transgenic plants compared with control plants. Black and grey bars represent relative expression of two independent lines. The expression of each gene was normalized to tobacco Ntα-Tub1. Error bars represent the SEs for four replicate reactions.
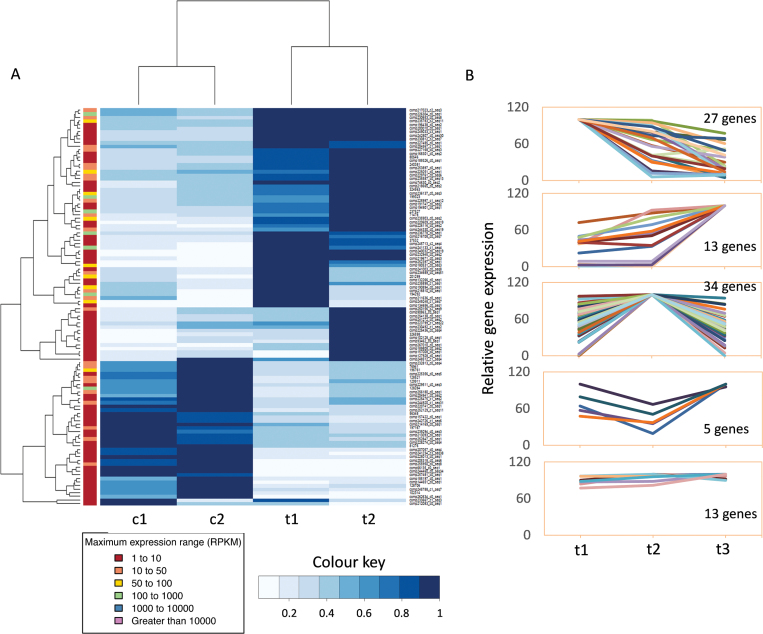
SVP2-mediated transcriptomic changes during winter dormancy. (A) Hierarchical clustering of 92 differentially expressed genes identified by transcriptome analysis of SVP2 transgenic lines (t) and control lines (c) at the endo-dormant stage (1) and transition to eco-dormancy after exposure to winter temperature (2). The columns represent comparisons between samples, and rows represent individual genes. The gene name, gene symbol, and RPKM of each gene can be found in Supplementary Table S5 and the higher resolution image is provided as Supplementary Fig. S4. The colour chart of blue and white indicates the RPKM value. Blue and white represent increased and decreased gene expression, respectively. (B) Transcriptome analysis of SVP2 transgenic lines during endo-dormancy (t1), eco-dormancy (t2), and initiation of budbreak (t3) identified five expression patterns for 92 differentially expressed genes.
References
-
- Bai S, Saito T, Sakamoto D, Ito A, Fujii H, Moriguchi T. 2013. Transcriptome analysis of Japanese pear (Pyrus pyrifolia Nakai) flower buds transitioning through endodormancy. Plant and Cell Physiology 54, 1132–1151. - PubMed
-
- Bai Y, Pattanaik S, Patra B, Werkman JR, Xie CH, Yuan L. 2011. Flavonoid-related basic helix–loop–helix regulators, NtAn1a and NtAn1b, of tobacco have originated from two ancestors and are functionally active. Planta 234, 363–375. - PubMed
-
- Bielenberg DG, Wang Y, Li ZG, Zhebentyayeva T, Fan SH, Reighard GL, Scorza R, Abbott AG. 2008. Sequencing and annotation of the evergrowing locus in peach [Prunus persica (L.) Batsch] reveals a cluster of six MADS-box transcription factors as candidate genes for regulation of terminal bud formation. Tree Genetics and Genomes 4, 495–507.
-
- Brundell DJ. 1976. The effect of chilling on the termination of rest and flower bud development of the Chinese gooseberry. Scientia Horticulturae 4, 175–182.
Publication types
MeSH terms
Substances
LinkOut - more resources
Full Text Sources
Other Literature Sources
Miscellaneous
