. 2017 Apr 7;45(6):3378-3394.
doi: 10.1093/nar/gkx066.

Cytidine deaminase efficiency of the lentiviral viral restriction factor APOBEC3C correlates with dimerization

Affiliations

Cytidine deaminase efficiency of the lentiviral viral restriction factor APOBEC3C correlates with dimerization

Madison B Adolph et al. Nucleic Acids Res. .

Abstract

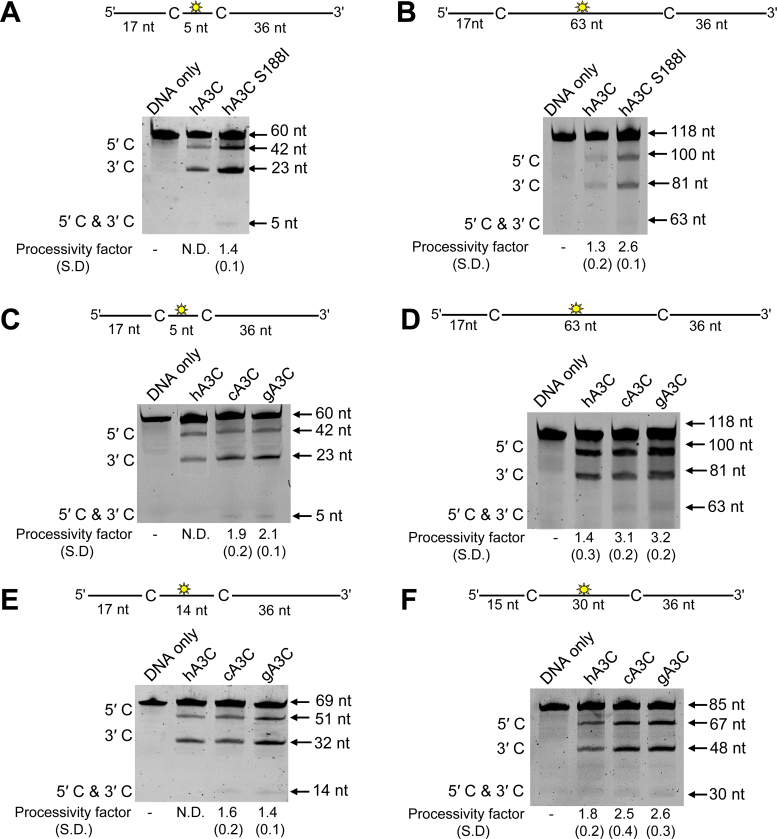
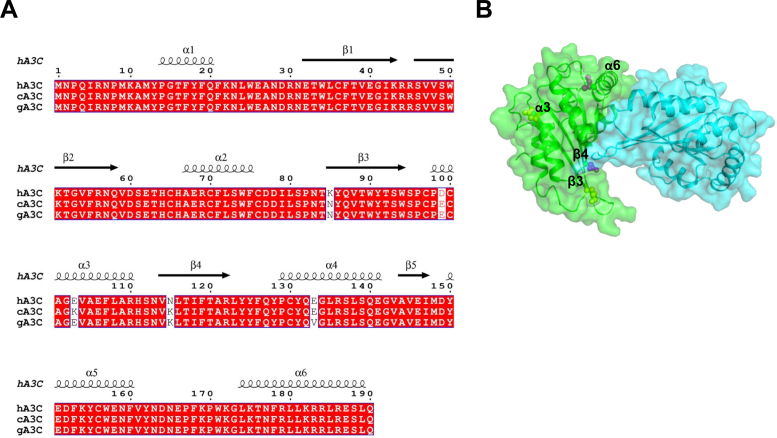
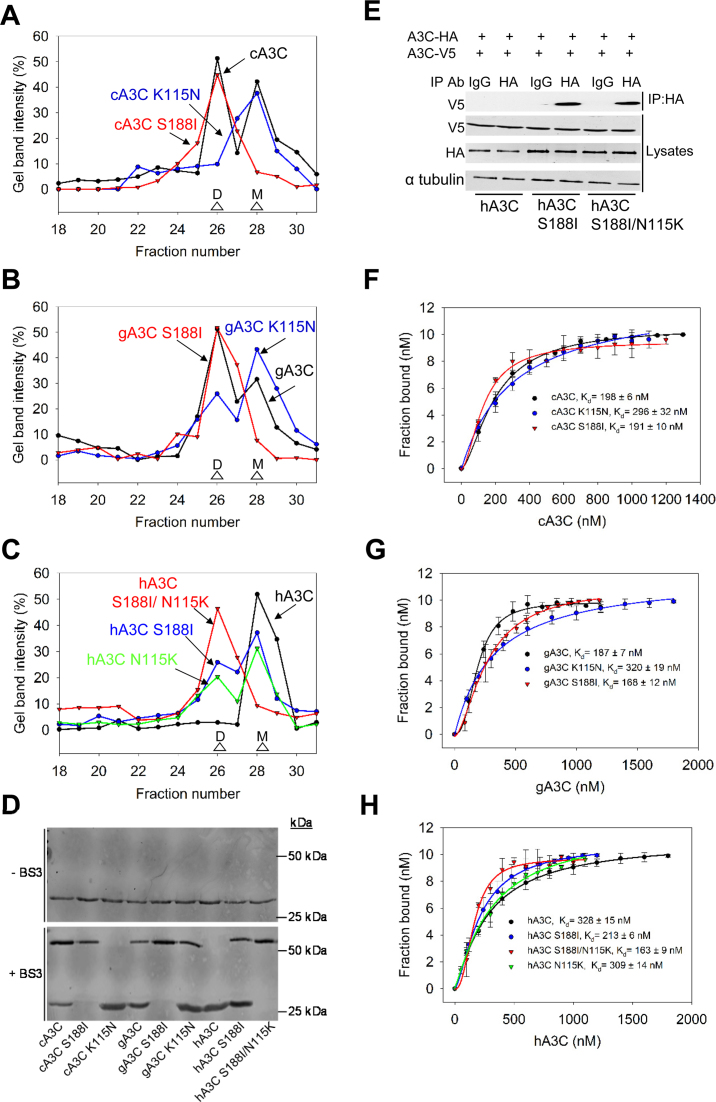
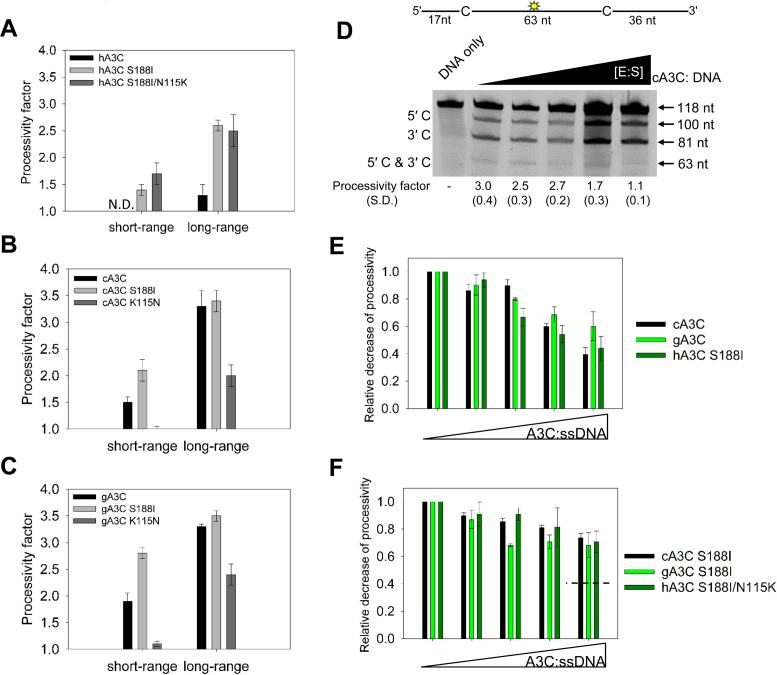
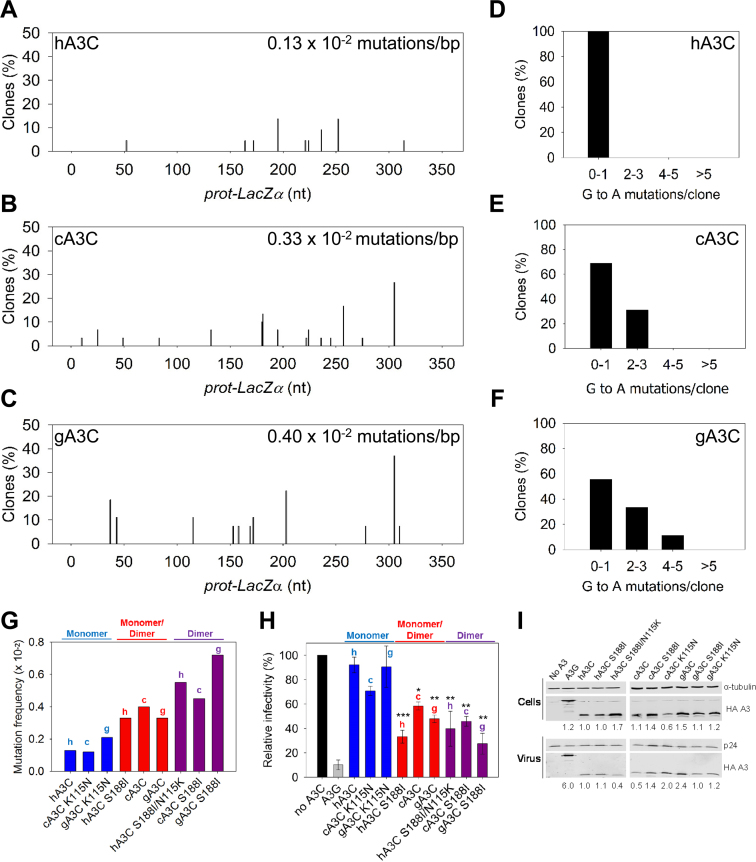
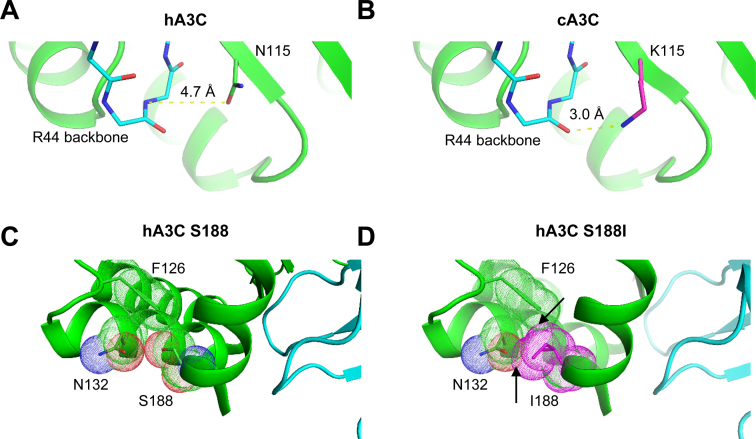
The seven APOBEC3 (A3) enzymes in primates restrict HIV/SIV replication to differing degrees by deaminating cytosine in viral (-)DNA, which forms promutagenic uracils that inactivate the virus. A polymorphism in human APOBEC3C (A3C) that encodes an S188I mutation increases the enzymatic activity of the protein and its ability to restrict HIV-1, and correlates with increased propensity to form dimers. However, other hominid A3C proteins only have an S188, suggesting they should be less active like the common form of human A3C. Nonetheless, here we demonstrate that chimpanzee and gorilla A3C have approximately equivalent activity to human A3C I188 and that chimpanzee and gorilla A3C form dimers at the same interface as human A3C S188I, but through different amino acids. For each of these hominid A3C enzymes, dimerization enables processivity on single-stranded DNA and results in higher levels of mutagenesis during reverse transcription in vitro and in cells. For increased mutagenic activity, formation of a dimer was more important than specific amino acids and the dimer interface is unique from other A3 enzymes. We propose that dimerization is a predictor of A3C enzyme activity.


Figures

Figure 1.
Figure 1.
Analysis of A3C processivity on ssDNA oligonucleotides. Processivity of A3C was tested on ssDNA substrates that contain a fluorescein-labeled deoxythymidine (yellow star) between two 5΄TTC deamination motifs separated by different distances. (A and B) hA3C S188I is more processive than hA3C. (A) Deamination of a 60 nt ssDNA substrate with deamination targets spaced 5 nt apart. Single deaminations of the 5΄C and 3΄C are detected as the appearance of labeled 42- and 23-nt fragments, respectively; double deamination of both C residues on the same molecule results in a 5 nt labeled fragment. (B) Deamination of a 118 nt ssDNA substrate with deaminated cytosines spaced 63 nt apart. Single deaminations of the 5΄C and 3΄C are detected as the appearance of labeled 100- and 81-nt fragments, respectively; double deamination of both C residues on the same molecule results in a 63 nt labeled fragment. (C–F) cA3C and gA3C are more processive than hA3C. (C) Deamination of a 60 nt ssDNA substrate as for panel (A). (D) Deamination of a 118 nt ssDNA as for panel (B). (E) Deamination of a 69 nt ssDNA substrate with deamination targets spaced 14 nt apart. Single deaminations of the 5΄C and 3΄C are detected as the appearance of labeled 51- and 32-nt fragments, respectively; double deamination of both C residues on the same molecule results in a 14 nt labeled fragment. (F) Deamination of an 85 nt ssDNA substrate with deaminated cytosines spaced 30 nt apart. Single deaminations of the 5΄C and 3΄C are detected as the appearance of labeled 67- and 48-nt fragments, respectively; double deamination of both C residues on the same molecule results in a 30 nt labeled fragment. If no 5΄C and 3΄C band was detected, the processivity was denoted with N.D. (not detected). The measurements of enzyme processivity (processivity factor) and the S.D. are shown below the gels. All values are calculated from at least three independent experiments.
Figure 2.
Figure 2.
Sequence alignment and structural analysis of A3C. (A) Sequence alignment of hA3C, cA3C and gA3C with amino acid differences shown in white. The sequence alignment was performed by a Clustal Omega multiple sequence alignment (75) and plotted using the program ESPript (76). (B) Surface representation of a hA3C dimer from the crystal structure (PDB: 3VOW). Amino acids unique to hA3C that are potentially involved in the dimer interface are shown in purple (α-helix 6, S188; β-strand 4, N115) and other amino acids unique to hA3C are shown in yellow (β-strand 3, K85; α-helix 3, D99).
Figure 3.
Figure 3.
A3C dimerization is mediated through α-helix 6 or β-strand 4. (A–C) SEC profile for 10 μg of (A) cA3C, cA3C K115N and cA3C S188I; (B) gA3C, gA3C K115N and gA3C S188I and (C) hA3C, hA3C S188I, hA3C N115K and hA3C S188I/N115K from a 10 ml Superdex 200 column was used to calculate the oligomerization state of the enzyme from a standard calibration curve. An M denotes a monomer fraction and a D denotes a dimer fraction. (A) cA3C formed monomers and dimers (apparent molecular weights 19 kDa and 45 kDa, respectively), cA3C S188I formed a stable dimer (apparent molecular weight 45 kDa), and cA3C K115N formed monomers (apparent molecular weight 19 kDa). (B) The gA3C SEC profiles were similar to cA3C, except for gA3C K115N that was mainly monomers (apparent molecular weight 19 kDa), but also retained a small proportion of dimers (apparent molecular weight 45 kDa). (C) hA3C formed monomers in solution (apparent molecular weight 19 kDa), hA3C S188I and hA3C N115K were an equilibrium of monomers and dimers (apparent molecular weights 19 kDa and 45 kDa, respectively) and hA3C S188I/N115K was a stable dimer (apparent molecular weight 45 kDa). The chromatograms were constructed by analyzing the integrated gel-band intensities of each protein in each fraction after resolution by SDS-PAGE (Supplementary Figure S3). (D) A3C enzymes were incubated in the absence or presence of 20 μM BS3 crosslinker and subsequently visualized with SDS-PAGE and immunoblotting. Monomeric A3C enzymes remained as monomers in the presence of crosslinker (cA3C K115N, hA3C). A3C enzymes that were able to form dimers according to SEC, were also present as monomers/dimers (cA3C, gA3C, gA3C K115N, hA3C S188I) or as dimers (cA3C S188I, gA3C S188I, hA3C S188I/N115K) in the presence of the crosslinker. Molecular weight standards are indicated. (E) Coimmunoprecipitation of A3C-V5 with A3C-HA. The A3C-HA and A3C-V5 were transfected in combination and the immunoprecipitation of cell lysates used either anti-HA antibody or Rabbit IgG (mock) and was immunoblotted with antibodies against α-tubulin, HA and V5. Cell lysates show the expression of α-tubulin, HA and V5. (F–H) The apparent Kd of A3C enzymes from a 118 nt ssDNA was analyzed by steady-state rotational anisotropy for (E) cA3C, cA3C S188I and cA3C K115N; (F) gA3C, gA3C S188I, and gA3C K115N and (G) hA3C, hA3C S188I, hA3C N115K and hA3C S188I/N115K. Apparent Kd values are shown in the figure. Hill coefficients for cooperative binding curves are (E) cA3C, 1.6; cA3C S188I, 1.7; (F) gA3C, 1.8; gA3C S188I, 2.1; (G) hA3C S188I, 1.6; hA3C N115K, 1.5; hA3C S188I/N115K, 1.9. Error bars represent the S.D. from three independent experiments.
Figure 4.
Figure 4.
Dimerization influences processive ssDNA scanning. Processivity of A3C mutants was tested on ssDNA substrates and compared to the wild type enzyme. (A–C) Processivity factor values are shown for short-range movements based on deamination of a 60 nt ssDNA substrate with deamination targets spaced 5 nt apart and long-range movements based on deamination of a 118 nt substrate with deaminated cytosines spaced 63 nt apart for (A) hA3C, hA3C S188I and hA3C S188I/N115K, (B) cA3C, cA3C S188I and cA3C K115N and (C) gA3C, gA3C S188I and gA3C K115N. See Supplementary Figure S4 for a representative gel. (D) Intersegmental transfer ability of cA3C was determined by keeping an A3C/ssDNA ratio of 7:1 constant, but increasing the total reaction components. If the enzyme is able to undergo intersegmental transfer, the assay will result in an apparent decrease in the processivity factor with increasing concentrations of reaction components. The ssDNA substrate contained a fluorescein-labeled deoxythymidine (yellow star) between two deamination targets separated by 63 nt. The measurements of enzyme processivity (processivity factor) and the S.D. are shown below the gel. (E and F) Summary of intersegmental transfer assays shown in Supplementary Figure S5. (E) The monomer/dimer forms of A3C (cA3C, gA3C, hA3C S188I) are better able to undergo intersegmental transfer than the (F) stable dimer forms of A3C (cA3C S188I, gA3C S188I, hA3C S188I/N115K). For comparison, the hatched line in (F) denotes the decrease in processivity observed for monomer/dimer forms of A3C in (E). All values are calculated from at least three independent experiments.
Figure 5.
Figure 5.
Monomeric A3C induces lower levels of mutagenesis than dimeric A3C. (A–G) An in vitro HIV replication assay was utilized to determine the enzymes abilities to catalyze deaminations during proviral DNA synthesis. (A–C) Spectra of mutations are plotted as the percentage of clones containing a G→A mutation at a particular location (nt) in the 368 nt prot-lacZα construct for (A) hA3C, (B) cA3C or (C) gA3C. (D–F) Histograms illustrate the number of mutations that can be induced by (D) hA3C, (E) cA3C or (F) gA3C within individual clones. (G) Summarized G→A mutation frequency for A3C monomers (hA3C, cA3C K115N, gA3C K115N), monomers/dimers (hA3C S188I, cA3C, gA3C), and dimers (hA3C S188I/N115K, cA3C S188I, gA3C S188I). The graph denotes whether the A3C is from human (h), chimpanzee (c) or gorilla (g). Individual spectra and clonal mutation frequencies not included in Figure 5 are in Supplementary Figure S6. (H) HIV Δvif infectivity was measured by β-galactosidase expression driven by the HIV-1 5΄LTR from HeLa CD4+ HIV-1 LTR-β-gal cells infected with HIV Δvif that was produced in the absence or presence of A3G or A3C orthologs. Relative decrease in virus infectivity is shown for A3G, A3C monomers (hA3C, cA3C K115N, gA3C K115N), A3C monomers/dimers (hA3C S188I, cA3C, gA3C) and A3C dimers (hA3C S188I/N115K, cA3C S188I, gA3C S188I). The graph denotes whether the A3C is from human (h), chimpanzee (c) or gorilla (g). Results normalized to the no A3 condition are shown with the Standard Deviation of the mean calculated from at least three independent experiments. Statistical significance of HIV Δvif restriction for each A3C ortholog was determined in comparison to the monomer form (hA3C, cA3C K115N or gA3C K115N). Designations for significant difference of values were ***P ≤ 0.001, **P ≤ 0.01 or *P ≤ 0.05. (I) Immunoblotting for the HA tag was used to detect A3 enzymes expressed in cells and encapsidated into HIV Δvif virions. The cell lysate and virion loading controls were α-tubulin and p24, respectively. Quantification of the relative amount of A3 was normalized to hA3C.
Figure 6.
Figure 6.
Models of A3C dimerization. (A) For hA3C, N115 (chain A) is 4.7 Å away from the backbone of R44 (chain B). (B) In contrast, a model of cA3C K115 (chain A) positions the backbone of R44 (chain B) only 3.0 Å away. This distance could indicate a new hydrogen bond with potential to stabilize the dimer between chains A and B. (C) In hA3C, S188, shown with van der Waal space filling dots, packs closely to F126 and N132, but does not clash with either. (D) In contrast, a model of hA3C shows how I188 would clash with F126 and N132 (arrows indicating overlap of van der Waal space filling dots). Conformational changes, potentially including a repositioning of the helix to enable formation of an A–B dimer, would be needed to accommodate this amino acid variant.

References

    1. Feng Y., Baig T.T., Love R.P., Chelico L.. Suppression of APOBEC3-mediated restriction of HIV-1 by Vif. Front. Microbiol. 2014; 5:450. - PMC - PubMed
    1. Yu Q., Konig R., Pillai S., Chiles K., Kearney M., Palmer S., Richman D., Coffin J.M., Landau N.R.. Single-strand specificity of APOBEC3G accounts for minus-strand deamination of the HIV genome. Nat. Struct. Mol. Biol. 2004; 11:435–442. - PubMed
    1. Mangeat B., Turelli P., Caron G., Friedli M., Perrin L., Trono D.. Broad antiretroviral defence by human APOBEC3G through lethal editing of nascent reverse transcripts. Nature. 2003; 424:99–103. - PubMed
    1. Harris R.S., Bishop K.N., Sheehy A.M., Craig H.M., Petersen-Mahrt S.K., Watt I.N., Neuberger M.S., Malim M.H.. DNA deamination mediates innate immunity to retroviral infection. Cell. 2003; 113:803–809. - PubMed
    1. Zhang H., Yang B., Pomerantz R.J., Zhang C., Arunachalam S.C., Gao L.. The cytidine deaminase CEM15 induces hypermutation in newly synthesized HIV-1 DNA. Nature. 2003; 424:94–98. - PMC - PubMed

Publication types