. 2017 May 5;45(8):4493-4506.
doi: 10.1093/nar/gkx058.

Abf1 and other general regulatory factors control ribosome biogenesis gene expression in budding yeast

Affiliations

Abf1 and other general regulatory factors control ribosome biogenesis gene expression in budding yeast

Maria Cristina Bosio et al. Nucleic Acids Res. .

Abstract

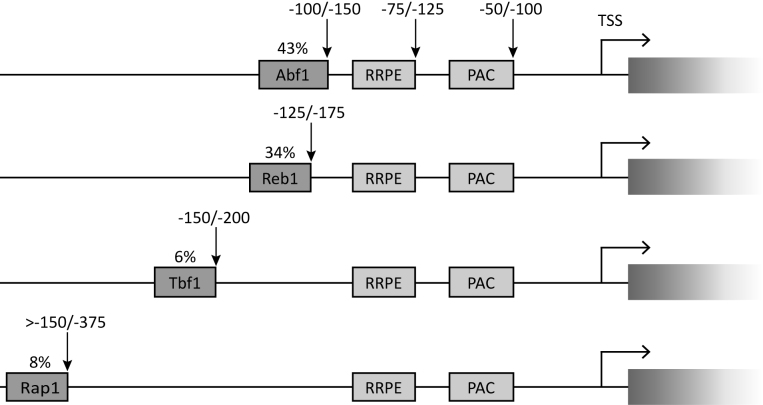
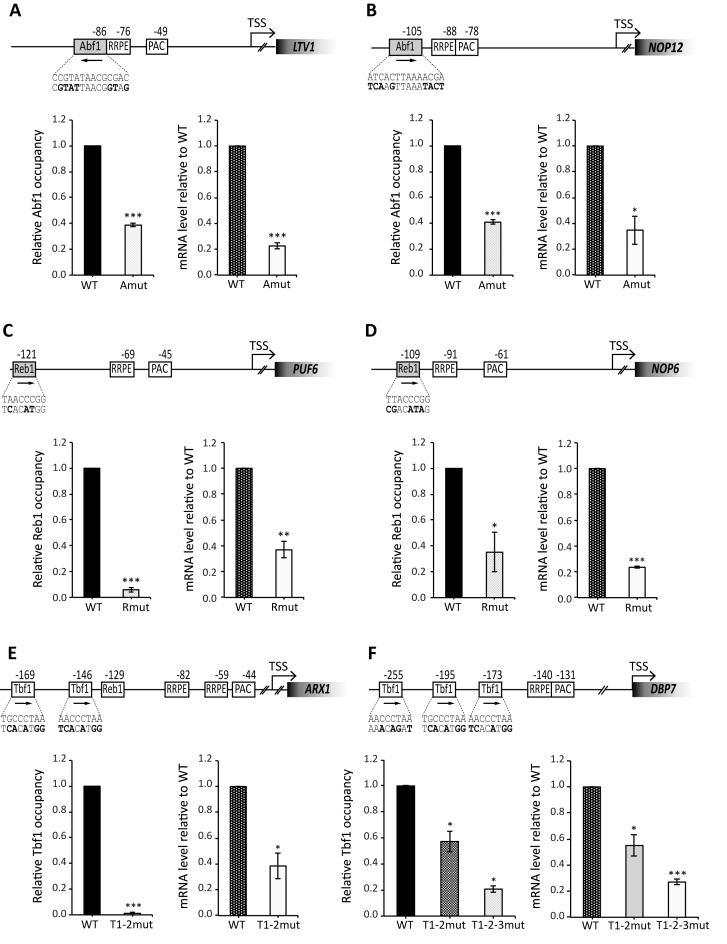
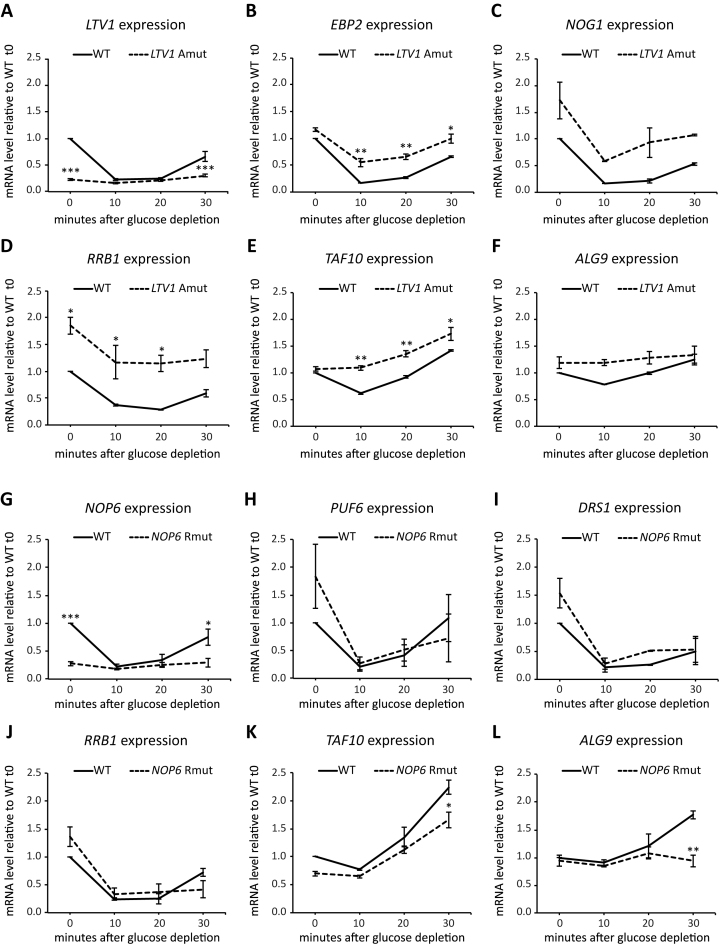
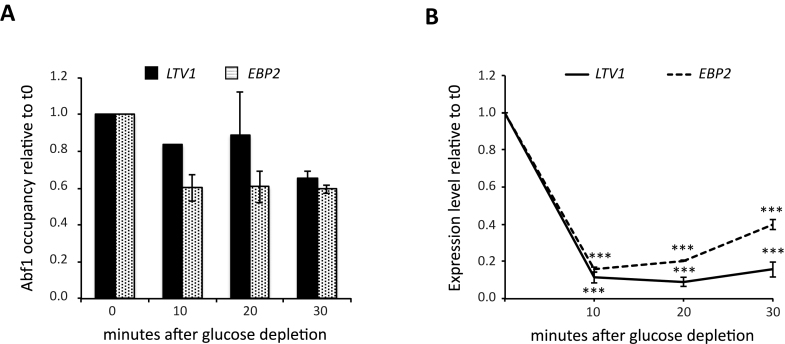
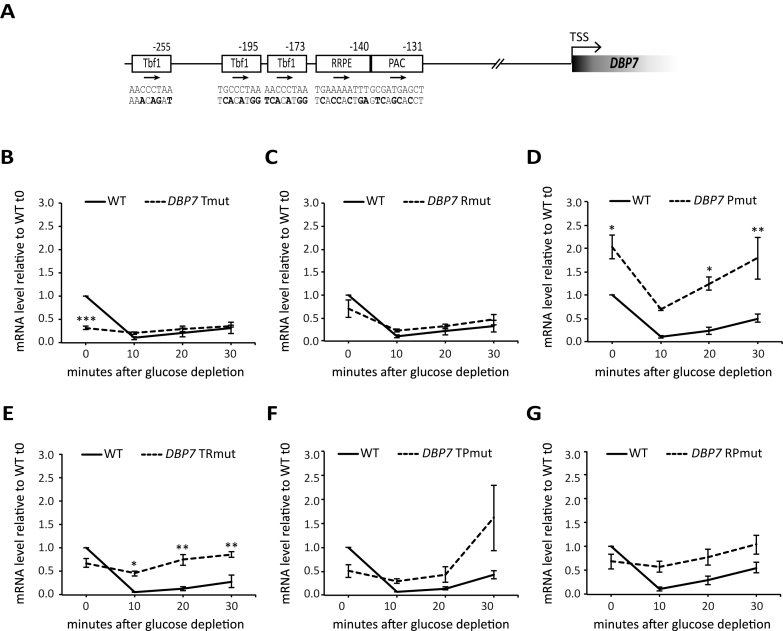
Ribosome biogenesis in Saccharomyces cerevisiae involves a regulon of >200 genes (Ribi genes) coordinately regulated in response to nutrient availability and cellular growth rate. Two cis-acting elements called PAC and RRPE are known to mediate Ribi gene repression in response to nutritional downshift. Here, we show that most Ribi gene promoters also contain binding sites for one or more General Regulatory Factors (GRFs), most frequently Abf1 and Reb1, and that these factors are enriched in vivo at Ribi promoters. Abf1/Reb1/Tbf1 promoter association was required for full Ribi gene expression in rich medium and for its modulation in response to glucose starvation, characterized by a rapid drop followed by slow recovery. Such a response did not entail changes in Abf1 occupancy, but it was paralleled by a quick increase, followed by slow decrease, in Rpd3L histone deacetylase occupancy. Remarkably, Abf1 site disruption also abolished Rpd3L complex recruitment in response to starvation. Extensive mutational analysis of the DBP7 promoter revealed a complex interplay of Tbf1 sites, PAC and RRPE in the transcriptional regulation of this Ribi gene. Our observations point to GRFs as new multifaceted players in Ribi gene regulation both during exponential growth and under repressive conditions.


Figures

Figure 1.
Figure 1.
Conserved sequence elements in Saccharomyces Ribi gene promoters. Graphical representations of promoter architecture of Ribi genes as derived from in silico analysis. The ∼20% of Ribi genes which did not display any conserved GRF binding site is not represented in the Figure. Indicated above each GRF box is the percentage of Ribi gene promoters in which the motif occurs. Vertical arrows pointing to the downstream end of the boxes are to indicate their range of distances (in base pairs, above the arrows) with respect to the TSS. The consensus sequences considered for the different elements reported are: PAC, GCGATGAGMT; RRPE, TGAAAAWTTTY; Abf1, RTCAYNNNN(N)ACGR; Reb1, RTTACCCK; Tbf1, ARCCCTAA; Rap1, WACAYCCRTACATY (M, A or C; W, A or T; R, A or G; Y, C or T; K, G or T; N, any nucleotide). These consensus sequences are based on the following references: PAC and RRPE (1); Abf1 (10,12,55); Reb1 (10,55); Tbf1 (10,12,18); Rap1 (56).
Figure 2.
Figure 2.
In vivo association of Abf1 and Reb1 to Ribi gene promoters. (A) Average binding profiles (normalized total counts) of Reb1 across the TSS regions of annotated yeast promoter regions for different set of gene lists as indicated in the inset (see text and Supplementary material). (B) Average binding profiles (normalized total counts) of Abf1 across the TSS regions of annotated yeast promoter regions for the same genes lists as in (A). (C) Genome browser plots showing normalized tags counts (and significant peaks in blue) of Abf1 and Reb1 binding for ribi genes (EFT2, LTV1 and EBP2) that showed significant enrichment for binding of Abf1 (but not Reb1). Bound gene is highlighted in green color. Relevant TF peaks and the corresponding Ribi genes are boxed. (D) Genome browser plots showing normalized tags counts (and significant peaks in blue) of Abf1 and Reb1 binding for Ribi genes (PUF6 and NOP6) that showed significant enrichment for Reb1 binding (but not Abf1) and NHP2, a Ribi gene whose promoter contains significant region of binding for both factors. Bound gene is highlighted in green color. Relevant TF peaks and the corresponding Ribi genes are boxed.
Figure 3.
Figure 3.
GRF requirements for Ribi gene expression. Functional analysis of six different Ribi gene promoters displaying binding sites respectively for Abf1 (LTV1, panel A; NOP12, panel B), Reb1 (PUF6, panel C; NOP6; panel D) and Tbf1 (ARX1, panel E; DBP7, panel F). Strains carrying mutations in the GRF binding site and a TAP-tagged allele of either ABF1 (LTV1 and NOP12), REB1 (PUF6, NOP6) or TBF1 (ARX1, DBP7) were analyzed for GRF occupancy at promoter and mRNA expression. For each gene, a schematic representation of the promoter region and of its alteration in the mutant construct is shown. Distances reported are with respect to TSS and mutated sequence in the GRF binding site is indicated under the corresponding wt sequence (mutated bases are in bold). Left graph: GRF occupancy in wild type (WT; black bars) and mutated strain (gray–white bars) assessed by ChIP-qPCR and calculated as fold-enrichment relative to HHT2. GRF enrichment at each promoter is reported as relative to the level of enrichment measured in the wt strain. Right graph: Ribi gene expression levels in wild type (WT, gray dotted bars) and mutant strains (white bars). mRNA levels were measured by RT-qPCR analysis of total RNA extracted from exponentially growing cells and expressed as relative to the expression level in the corresponding wt strain. Data are represented as mean ± SEM calculated in three independent experiments. An unpaired Student's t-test was used to compare the means of measurements. *P < 0.05; **P < 0.01; ***P < 0.001.
Figure 4.
Figure 4.
Nutrient-dependent regulation of expression from wt and mutant Ribi gene promoters. (A–F) Exponentially growing yeast strains carrying either wild type (WT) or Abf1 site-mutated LTV1 gene (LTV1 Amut) were shifted to YP medium without glucose. Samples were collected before (0) and 10, 20 or 30 min after the shift for total RNA extraction and RT-qPCR analysis. Expression levels of LTV1 (A), EBP2 (B), NOG1 (C), RRB1 (D), TAF10 (E) and ALG9 (F) in wt and mutant strains at each time point are reported as relative to mRNA level measured in wt cells before shift (0). (G–L) Exponentially growing yeast strains carrying either wild type (WT) or Reb1 site-mutated NOP6 gene (NOP6 Rmut) were shifted to YP medium without glucose. Samples were collected before and 10, 20 or 30 min after the shift for total RNA extraction and RT-qPCR analysis. Expression levels of NOP6 (G), PUF6 (H), DRS1 (I), RRB1 (J), TAF10 (K) and ALG9 (L) in wt and mutant strains at each time point are reported as relative to mRNA level measured in wt cells before shift (0). In all panels, data are reported as mean ± SEM of three independent replicates. A one-way ANOVA test was used to compare the means of measurements for the mutant with respect to the corresponding wt strain at each time point. *P < 0.05; **P < 0.01; ***P < 0.001 using a Tukey post-hoc test.
Figure 5.
Figure 5.
Effects of glucose starvation on Abf1 association with Ribi gene promoters. An exponentially growing Abf1 TAP-tagged yeast culture was shifted to YP medium without glucose. Samples were collected before (0) and 10, 20 or 30 min after shift for ChIP-qPCR analysis of Abf1 enrichment and RT-qPCR analysis of LTV1 and EBP2 gene expression. (A) Abf1 enrichment for LTV1 (black bars) and EBP2 (white dotted bars); GRF occupancy level at each time point is reported as relative to the level measured in cells before shift in YP (0). (B) Expression level of LTV1 (black line) and EBP2 (black dotted line) reported as relative to the mRNA level measured in cells collected before shift in YP (0). Data are reported as mean ± SEM of two independent replicates. For eacg gene, a one-way ANOVA test was used to compare the means of measurements for each time point with respect to t0. ***P < 0.001 using a Tukey post-hoc test.
Figure 6.
Figure 6.
Rpd3L histone deacetylase recruitment at LTV1 promoter. Indicated strains expressing the Sds3-13xMyc-tagged protein were grown exponentially in YPD at 30°C and shifted to YP medium without glucose. Samples were collected before shift and after 10, 20 or 30 min for ChIP-qPCR analysis of Sds3-13xMyc association with the LTV1 promoter. Fold-enrichment relative to the control ADH4 promoter is represented in either wild type (WT, black bars) and promoter-mutated LTV1 gene at Abf1 binding site (LTV1 Amut, white dotted bars). Data are presented as mean ± SEM of four independent replicates. For wild type, a one-way ANOVA test was used to compare the means of measurements at each time point respect to WT t0; for the enrichment in the mutant a one-way ANOVA test was used to compare the means of measurements of mutants with respect to WT at each time point. *P < 0.05, **P < 0.01, ***P < 0.001 using a Tukey post-hoc test.
Figure 7.
Figure 7.
Mutational analysis of DBP7 promoter. (A) Schematic representation of DBP7 promoter region with conserved cis-regulatory element. All positions reported are with respect to the TSS; the wt sequence and the mutated version of the regulatory element in the different mutants are indicated below the corresponding box (mutated bases, bold character). (B–G) Exponentially growing yeast strains carrying either wild type (WT, black line) or a promoter-mutated DBP7 gene (dashed line in each panel); (B) Tmut, mutant in the three Tbf1 binding sites; (C) Rmut, mutated in the RRPE; (D) Pmut, mutated in the PAC element; (E) TRmut, mutated in both RRPE and all Tbf1 sites; (F) TPmut, mutated in both PAC and all Tbf1 sites; (G) RPmut, mutated in both RRPE and PAC elements) were shifted from YPD to YP medium without glucose. Samples were collected before (0) and 10, 20 or 30 min after the shift for total RNA extraction and RT-qPCR analysis of DBP7 expression. The DBP7 mRNA levels for wt and mutant strains reported in each panel are expressed as relative to those observed in the corresponding wt cells before shift in YP. Data were collected from three independent replicates and are reported as mean ± SEM. A one-way ANOVA test was used to compare the means of measurements for the mutant with respect to wt at each time point. *P < 0.05, **P < 0.01, ***P < 0.001 using a Tukey post-hoc test. Reported data for the wt were the same for panels B and C, while they were derived from independent measurements in panels D–G.

References

    1. Bosio M.C., Negri R., Dieci G.. Promoter architectures in the yeast ribosomal expression program. Transcription. 2011; 2:71–77. - PMC - PubMed
    1. Lempiainen H., Shore D.. Growth control and ribosome biogenesis. Curr. Opin. Cell Biol. 2009; 21:855–863. - PubMed
    1. Warner J.R. The economics of ribosome biosynthesis in yeast. Trends Biochem. Sci. 1999; 24:437–440. - PubMed
    1. Dieci G., Preti M., Montanini B.. Eukaryotic snoRNAs: a paradigm for gene expression flexibility. Genomics. 2009; 94:83–88. - PubMed
    1. Huber A., French S.L., Tekotte H., Yerlikaya S., Stahl M., Perepelkina M.P., Tyers M., Rougemont J., Beyer A.L., Loewith R.. Sch 9 regulates ribosome biogenesis via Stb3, Dot6 and Tod6 and the histone deacetylase complex RPD3L. EMBO J. 2011; 30:3052–3064. - PMC - PubMed

MeSH terms