. 2017 Mar 1;58(3):560-573.
doi: 10.1093/pcp/pcx001.

Complementary Proteome and Transcriptome Profiling in Developing Grains of a Notched-Belly Rice Mutant Reveals Key Pathways Involved in Chalkiness Formation

Affiliations

Complementary Proteome and Transcriptome Profiling in Developing Grains of a Notched-Belly Rice Mutant Reveals Key Pathways Involved in Chalkiness Formation

Zhaomiao Lin et al. Plant Cell Physiol. .

Abstract

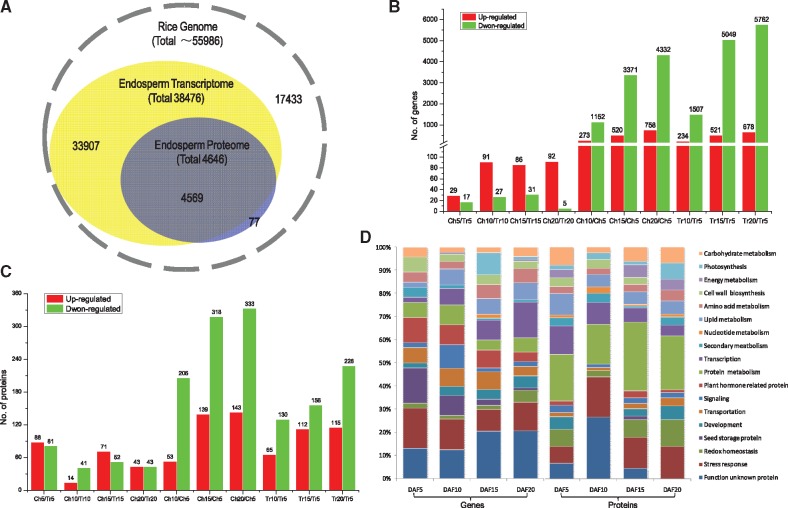
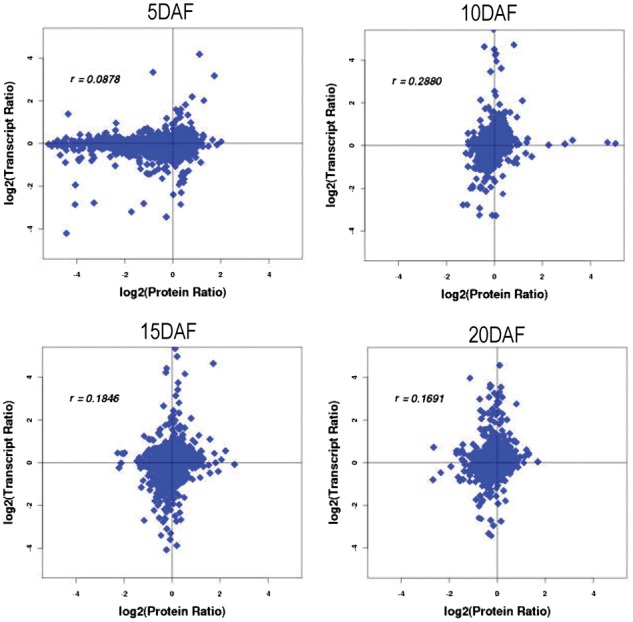
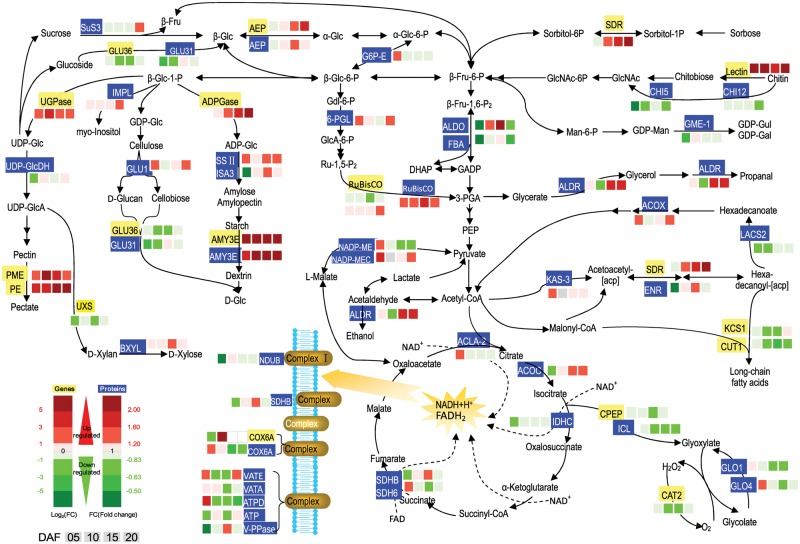
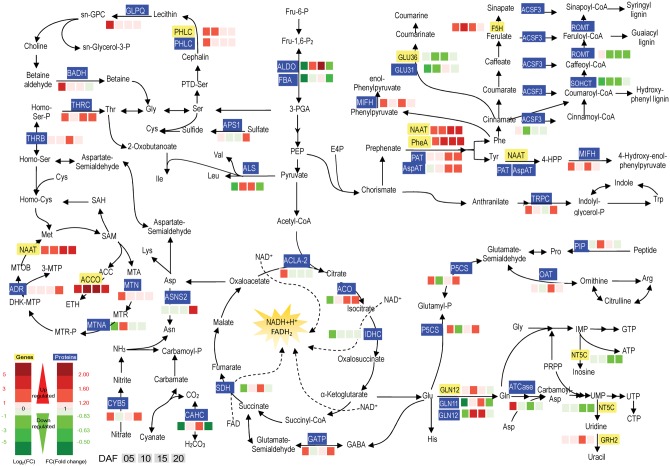
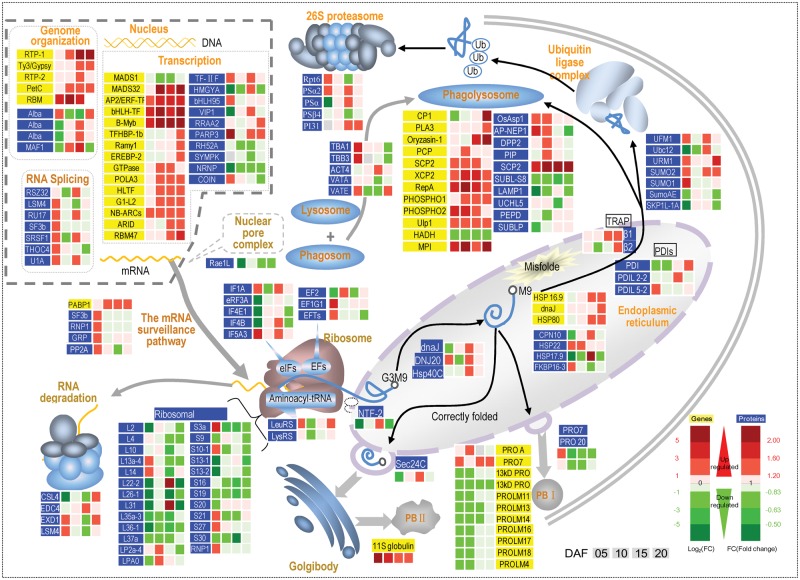
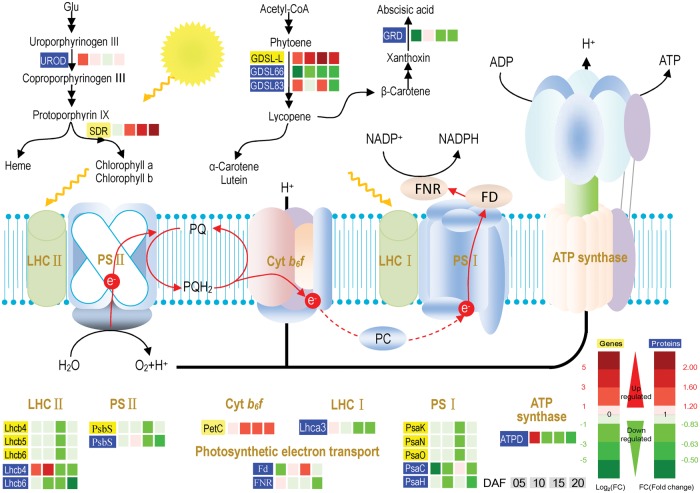
Rice grain chalkiness is a highly complex trait involved in multiple metabolic pathways and controlled by polygenes and growth conditions. To uncover novel aspects of chalkiness formation, we performed an integrated profiling of gene activity in the developing grains of a notched-belly rice mutant. Using exhaustive tandem mass spectrometry-based shotgun proteomics and whole-genome RNA sequencing to generate a nearly complete catalog of expressed mRNAs and proteins, we reliably identified 38,476 transcripts and 3,840 proteins. Comparison between the translucent part and chalky part of the notched-belly grains resulted in only a few differently express genes (240) and differently express proteins (363), thus making it possible to focus on 'core' genes or common pathways. Several novel key pathways were identified as of relevance to chalkiness formation, in particular the shift of C and N metabolism, the down-regulation of ribosomal proteins and the resulting low abundance of storage proteins especially the 13 kDa prolamin subunit, and the suppressed photosynthetic capacity in the pericarp of the chalky part. Further, genes and proteins as transporters for carbohydrates, amino acid/peptides, proteins, lipids and inorganic ions showed an increasing expression pattern in the chalky part of the notched-belly grains. Similarly, transcripts and proteins of receptors for auxin, ABA, ethylene and brassinosteroid were also up-regulated. In summary, this joint analysis of transcript and protein profiles provides a comprehensive reference map of gene activity regarding the physiological state in the chalky endosperm.

Keywords: Chalkiness; Proteome; Rice; Transcriptome; White-belly mutant.


Figures

Fig. 1
Fig. 1
Developing grains at 5, 10, 15 and 20 days after flowering (DAF) of the notched-belly mutant.
Fig. 2
Fig. 2
Comparison of protein and transcript abundance in developing rice grains. (A) Congruency between the detected transcripts and proteins of rice endosperm. (B) Number of differentially expressed genes in relation to developmental and chalkiness effects (absolute value of log2Ratio ≥1 with probability ≥0.8); Ch5, Ch10, Ch15, and Ch20, chalky part at 5, 10, 15 and 20 days after flowering (DAF); Tr5, Tr10, Tr15 and Tr20, translucent part at 5, 10, 15 and 20 DAF. (C) Number of differentially expressed proteins in relation to developmental and chalkiness (occurence) effects (1.2-fold change with P-value <0.05). (D) Functional classification and distribution of the differentially expressed genes and proteins between the chalky and translucent parts at four time points via the Gene Ontology (GO) database.
Fig. 3
Fig. 3
Concordance between changes in the abundance of mRNA and its encoded protein in the developing grains at four sampling times. Transcript ratio and Protein ratio, the fold changes of transcript and protein between the upper translucent part (Tr) and bottom chalky part (Ch) in rice endosperm, respectively. r, Pearson correlations coefficeint of the comparisons between fold changes of proteins and transcripts at each sampling time.
Fig. 4
Fig. 4
Expression patterns of genes and proteins for carbohydrate metabolism in the upper translucent part (Tr) and the bottom chalky part (Ch) of the notched-belly grains. Annotations of genes and proteins are available in Supplementary Tables S4 and S5. Black characters with yellow background are genes, whereas white characters with blue background are proteins. The four squares under the names of genes or proteins indicate abundance change of Ch5/Tr5, Ch10/Tr10, Ch15/Tr15 and Ch20/Tr20, respectively. A red square indicates up-regulation, whereas a green square indicates down-regulation.
Fig. 5
Fig. 5
Expression patterns of genes and proteins for amino acid metabolism in the upper translucent part and the bottom chalky part of the notched-belly grains. Annotations of genes and proteins are available in Supplementary Tables S4 and S5. Black characters with yellow background are genes, whereas white characters with blue background are proteins. The four squares under the names of genes or proteins indicate abundance change of Ch5/Tr5, Ch10/Tr10, Ch15/Tr15 and Ch20/Tr20, respectively. A red square indicates up-regulation, whereas a green square indicates down-regulation.
Fig. 6
Fig. 6
Expression patterns of genes and proteins for protein assembly and degradation in the upper translucent part and the bottom chalky part of the notched-belly grains. Annotations of genes and proteins are availabble in Supplementary Tables S4 and S5. Black characters with yellow background are genes, whereas white characters with blue background are proteins. The four squares under the names of genes or proteins indicate an abundance change of Ch5/Tr5, Ch10/Tr10, Ch15/Tr15 and Ch20/Tr20, respectively. A red square indicates up-regulation, whereas a green square indicates down-regulation.
Fig. 7
Fig. 7
Expression patterns of genes and proteins for photosynthesis in the upper translucent part (Tr) and the bottom chalky part (Ch) of the notched-belly grains. Annotations of genes and proteins are available in Supplementary Tables S4 and S5. Black characters with yellow background are genes, whereas white characters with blue background are proteins. The four squares under the names of genes or proteins indicate abundance change of Ch5/Tr5, Ch10/Tr10, Ch15/Tr15 and Ch20/Tr20, respectively. A red square indicates up-regulation, whereas a green square indicates own-regulation.

References

    1. Audic S., Claverie J.M. (1997) The significance of digital gene expression profiles. Genome Res. 7: 986–995. - PubMed
    1. Caley C.Y., Duffus C.M., Jeffcoat B. (1990) Photosynthesis in the pericarp of developing wheat grains. J. Exp. Bot. 41: 303–307.
    1. Cho K., Agrawal G.K., Shibato J., Jung Y.H., Kim Y.K., Nahm B.H., et al. (2007) Survey of differentially expressed proteins and genes in jasmonic acid treated rice seedling shoot and root at the proteomics and transcriptomics levels. J. Proteome Res. 6: 3581–3603. - PubMed
    1. Cho K., Shibato J., Agrawal G.K., Jung Y.H., Kubo A., Jwa N.S., et al. (2008) Integrated transcriptomics, proteomics, and metabolomics analyses to survey ozone responses in the leaves of rice seedling. J. Proteome Res. 7: 2980–2998. - PubMed
    1. Duan M., Sun S.S. (2005) Profiling the expression of genes controlling rice grain quality. Plant Mol. Biol. 59: 165–178. - PubMed

MeSH terms

LinkOut - more resources