

Socioeconomic status and the 25 × 25 risk factors as determinants of premature mortality: a multicohort study and meta-analysis of 1·7 million men and women
- PMID: 28159391
- PMCID: PMC5368415
- DOI: 10.1016/S0140-6736(16)32380-7
Socioeconomic status and the 25 × 25 risk factors as determinants of premature mortality: a multicohort study and meta-analysis of 1·7 million men and women
Erratum in
-
Department of Error.Lancet. 2017 Mar 25;389(10075):1194. doi: 10.1016/S0140-6736(17)30311-2. Epub 2017 Feb 8. Lancet. 2017. PMID: 28187912 Free PMC article. No abstract available.
-
Department of Error.Lancet. 2017 Mar 25;389(10075):1194. doi: 10.1016/S0140-6736(17)30606-2. Epub 2017 Feb 28. Lancet. 2017. PMID: 28256355 Free PMC article. No abstract available.
Abstract
Background: In 2011, WHO member states signed up to the 25 × 25 initiative, a plan to cut mortality due to non-communicable diseases by 25% by 2025. However, socioeconomic factors influencing non-communicable diseases have not been included in the plan. In this study, we aimed to compare the contribution of socioeconomic status to mortality and years-of-life-lost with that of the 25 × 25 conventional risk factors.
Methods: We did a multicohort study and meta-analysis with individual-level data from 48 independent prospective cohort studies with information about socioeconomic status, indexed by occupational position, 25 × 25 risk factors (high alcohol intake, physical inactivity, current smoking, hypertension, diabetes, and obesity), and mortality, for a total population of 1 751 479 (54% women) from seven high-income WHO member countries. We estimated the association of socioeconomic status and the 25 × 25 risk factors with all-cause mortality and cause-specific mortality by calculating minimally adjusted and mutually adjusted hazard ratios [HR] and 95% CIs. We also estimated the population attributable fraction and the years of life lost due to suboptimal risk factors.
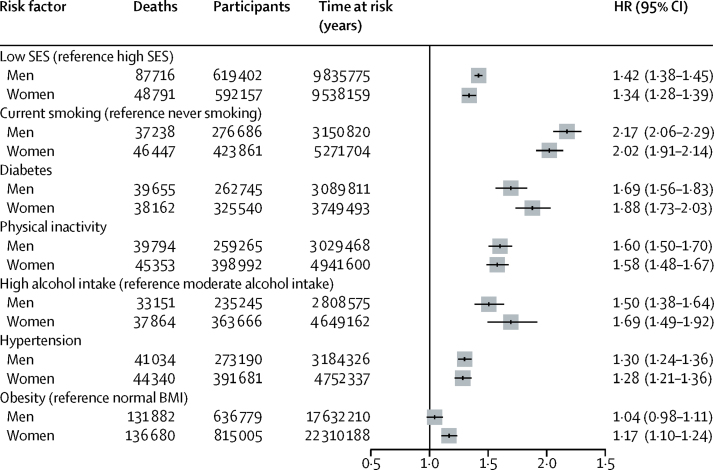
Findings: During 26·6 million person-years at risk (mean follow-up 13·3 years [SD 6·4 years]), 310 277 participants died. HR for the 25 × 25 risk factors and mortality varied between 1·04 (95% CI 0·98-1·11) for obesity in men and 2 ·17 (2·06-2·29) for current smoking in men. Participants with low socioeconomic status had greater mortality compared with those with high socioeconomic status (HR 1·42, 95% CI 1·38-1·45 for men; 1·34, 1·28-1·39 for women); this association remained significant in mutually adjusted models that included the 25 × 25 factors (HR 1·26, 1·21-1·32, men and women combined). The population attributable fraction was highest for smoking, followed by physical inactivity then socioeconomic status. Low socioeconomic status was associated with a 2·1-year reduction in life expectancy between ages 40 and 85 years, the corresponding years-of-life-lost were 0·5 years for high alcohol intake, 0·7 years for obesity, 3·9 years for diabetes, 1·6 years for hypertension, 2·4 years for physical inactivity, and 4·8 years for current smoking.
Interpretation: Socioeconomic circumstances, in addition to the 25 × 25 factors, should be targeted by local and global health strategies and health risk surveillance to reduce mortality.
Funding: European Commission, Swiss State Secretariat for Education, Swiss National Science Foundation, the Medical Research Council, NordForsk, Portuguese Foundation for Science and Technology.
Copyright © 2017 The Author(s). Published by Elsevier Ltd. This is an Open Access article under the CC BY license. Published by Elsevier Ltd.. All rights reserved.
Figures


Comment in
-
Social rank: a risk factor whose time has come?Lancet. 2017 Mar 25;389(10075):1172-1174. doi: 10.1016/S0140-6736(17)30191-5. Epub 2017 Feb 1. Lancet. 2017. PMID: 28159389 No abstract available.
References
-
- WHO . Global action plan for the prevention and control of noncommunicable diseases 2013–2020. World Health Organization; Geneva, Switzerland: 2013.
-
- Mackenbach JP, Stirbu I, Roskam AJ. Socioeconomic inequalities in health in 22 European countries. N Engl J Med. 2008;358:2468–2481. - PubMed
Publication types
MeSH terms
Grants and funding
LinkOut - more resources
Full Text Sources
Other Literature Sources
Medical
