. 2017 Feb 21;114(8):1976-1981.
doi: 10.1073/pnas.1621418114. Epub 2017 Feb 3.

Dynamics of SIV-specific CXCR5+ CD8 T cells during chronic SIV infection

Affiliations

Dynamics of SIV-specific CXCR5+ CD8 T cells during chronic SIV infection

Geetha H Mylvaganam et al. Proc Natl Acad Sci U S A. .

Erratum in

Abstract

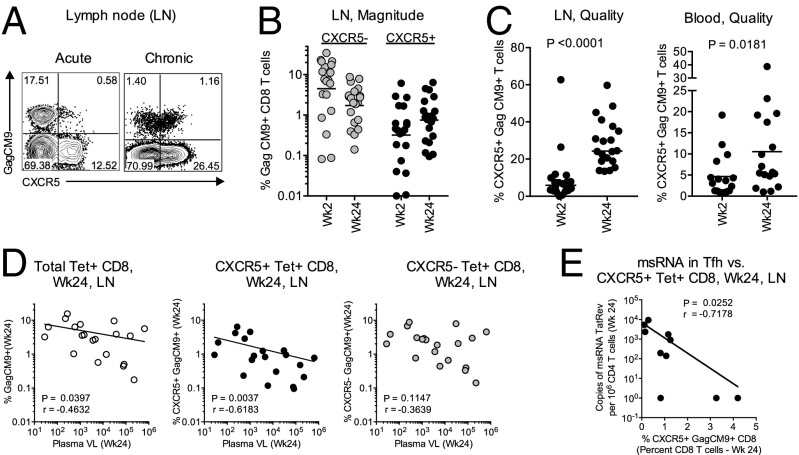
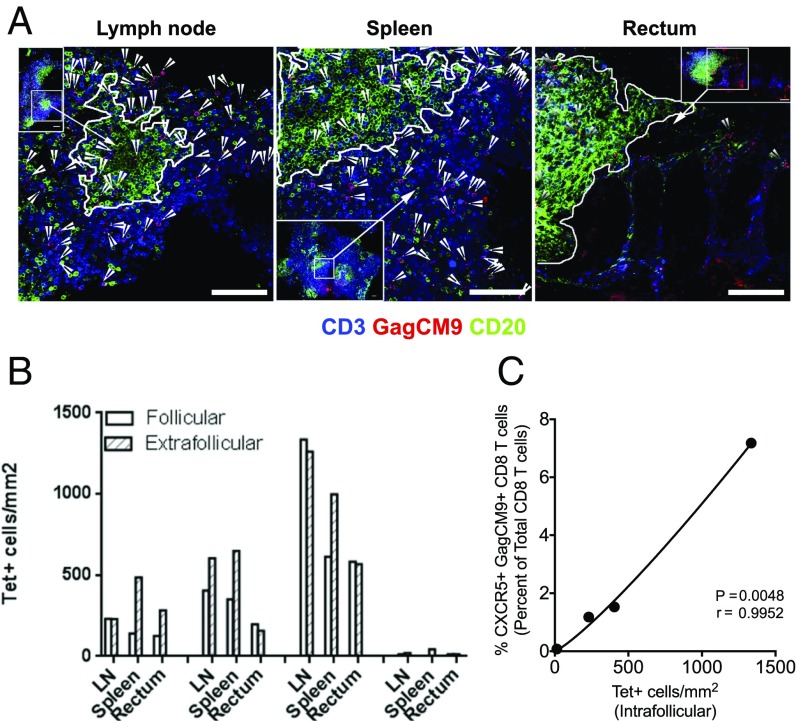
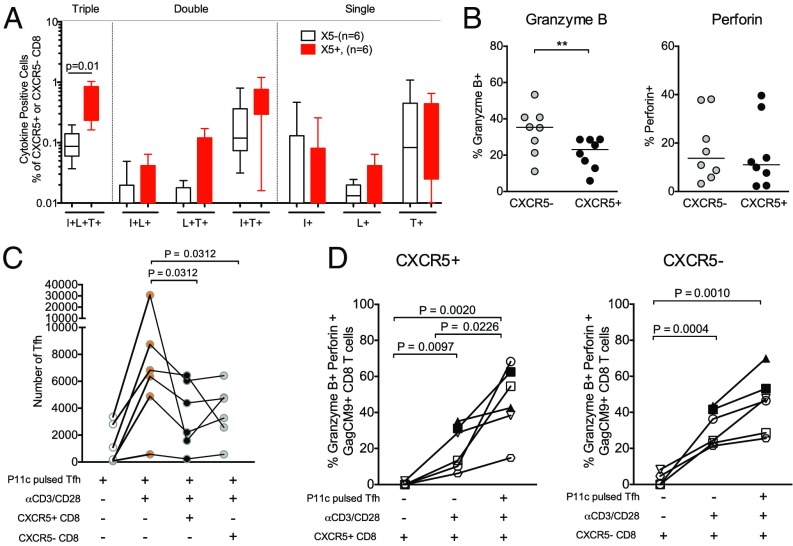
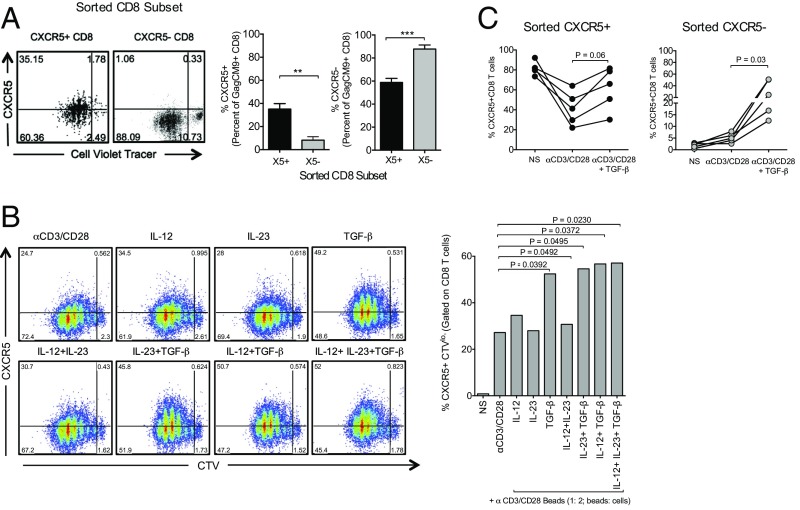
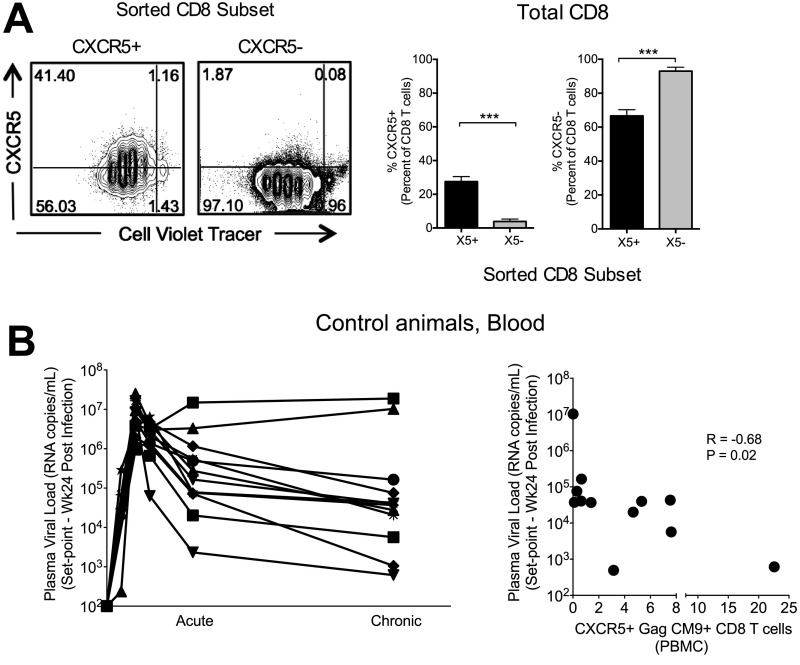
A significant challenge to HIV eradication is the elimination of viral reservoirs in germinal center (GC) T follicular helper (Tfh) cells. However, GCs are considered to be immune privileged for antiviral CD8 T cells. Here, we show a population of simian immunodeficiency virus (SIV)-specific CD8 T cells express CXCR5 (C-X-C chemokine receptor type 5, a chemokine receptor required for homing to GCs) and expand in lymph nodes (LNs) following pathogenic SIV infection in a cohort of vaccinated macaques. This expansion was greater in animals that exhibited superior control of SIV. The CXCR5+ SIV-specific CD8 T cells demonstrated enhanced polyfunctionality, restricted expansion of antigen-pulsed Tfh cells in vitro, and possessed a unique gene expression pattern related to Tfh and Th2 cells. The increase in CXCR5+ CD8 T cells was associated with the presence of higher frequencies of SIV-specific CD8 T cells in the GC. Following TCR-driven stimulation in vitro, CXCR5+ but not CXCR5- CD8 T cells generated both CXCR5+ as well as CXCR5- cells. However, the addition of TGF-β to CXCR5- CD8 T cells induced a population of CXCR5+ CD8 T cells, suggesting that this cytokine may be important in modulating these CXCR5+ CD8 T cells in vivo. Thus, CXCR5+ CD8 T cells represent a unique subset of antiviral CD8 T cells that expand in LNs during chronic SIV infection and may play a significant role in the control of pathogenic SIV infection.

Keywords: CXCR5+CD8+ T cells; HIV; SIV; follicular CD8 T cells; lymphoid follicles.


Conflict of interest statement

Conflict of interest statement: R.R.A. is a coinventor of DNA/MVA vaccine technology, and Emory University licensed this technology to Geovax Inc.

Figures

Fig. 1.
Fig. 1.
Rapid expansion of CXCR5+ SIV-specific CD8 T cells is associated with enhanced control of chronic SIV infection. (A) Representative FACS plots showing CXCR5 expression on Gag CM9 tetramer+ CD8 T cells (Tet+) following SIVmac251 infection in LNs. (B) Magnitude of CXCR5– and CXCR5+ Tet+ CD8 T cells in the LNs during acute (Wk2) and chronic (Wk24) phases of SIV infection (n = 20). (C) The proportion of Gag CM9 tetramer+ cells expressing CXCR5 in LNs (n = 20) and blood (n = 17). (D) Correlation between the magnitude of total, CXCR5+, or CXCR5– tetramer+ CD8 T cells and set-point plasma VLs in the LNs (n = 20). (E) Correlation between the frequency of CXCR5+ Tet+ CD8 T cells and the msRNA of TatRev in GC–Tfh cells in the LNs at week 24 postinfection (n = 10). Horizontal lines show the median.
Fig. S1.
Fig. S1.
(A) Kinetics of plasma VLs in vaccinated animals. (B) Correlation of CXCR5+ Gag CM9 tetramer+ cells between LNs and blood during the chronic phase (n = 17). (C) Correlation between Tet+, CXCR5+, and CXCR5– CD8 T-cell subsets in the LNs and plasma VLs at week 24 post-SIV infection. (D) Correlation between the frequency of CXCR5+ Tet+ CD8 T cells and cell-associated DNA within the GC–Tfh subsets at week 24 postinfection (n = 10). (E) Comparison of CXCR5 expression on CD8 T cells on unstimulated and Gag CM9 peptide-stimulated cells. On unstimulated cells, Gag CM9 tetramer was used to identify SIV Gag-specific CD8 T cells. On stimulated cells, intracellular IFNγ was used to identify SIV Gag-specific CD8 T cells.
Fig. 2.
Fig. 2.
CXCR5+ CD8 T cells are localized in the GCs of vaccinated low-VL RMs. (A) Representative in situ tetramer staining of Gag CM9 (red), CD20 (green), and CD3 (blue) of LN, spleen, and rectal tissue sections from a SIV low-VL RM showing the presence of Gag CM9 tetramer+ cells in the GC. The confocal images were collected with a 20× objective and each scale bar indicates 100 μm. Arrowheads indicate tetramer+ cells. (B) Density of follicular and extrafollicular tetramer+ cells in LN, spleen, and rectum (n = 4) of four low-VL RMs. (C) Correlation between the frequency of CXCR5+ Gag CM9+ CD8 T cells (% of CD8) measured by flow cytometry and absolute number of follicular Gag CM9+ CD8 T cells measured by in situ tetramer staining (n = 4).
Fig. S2.
Fig. S2.
Representative in situ tetramer staining images of MLN, spleen, and rectal tissue sections from SIV+-vaccinated controller RMs (n = 3) showing the presence of Gag CM9 tetramer+ cells in lymphoid aggregates. The confocal images were collected with a 20× objective and each scale bar indicates 100 μm. Arrowheads indicate follicular tetramer+ cells.
Fig. S3.
Fig. S3.
(A) Representative immunofluorescence staining for CD8 (green), IgD (blue), and PD-1 (red) of LN sections from SIV+ noncontroller (n = 3) and SIV+ vaccine controller (n = 3) RMs at week 24 post-SIV infection. (B) Representative immunofluorescence staining of CXCR5 (red), CD8 (green), and IgD (blue) of a LN section from a vaccinated low-VL RM showing the presence of intrafollicular CD8 T cells coexpressing CXCR5. (C) Granzyme B transfer to Tfh cells for the experiment described in Fig. 3D. The confocal images were collected with a 20× objective and each scale bar indicates 100 μm.
Fig. 3.
Fig. 3.
CXCR5+ SIV-specific CD8 T cells express cytolytic molecules and limit SIV antigen-pulsed Tfh expansion in vitro. (A) The frequency of cytokine coexpressing cells in response to P11c (Gag CM9) peptide stimulation. I, IFN-γ; L, IL-2; T, TNF-α. Scatter plots show the median. (B) Expression of granzyme B and perforin on CXCR5+ and CXCR5– Gag CM9 tetramer+ CD8 T cells at week 24 postinfection in the LNs (n = 8). (C) Tfh cell-limited expansion assay showing sorted GC–Tfh cells pulsed with P11c peptide and cultured alone, driven to expand with αCD3/CD28 stimulation with or without autologous sorted CXCR5+ and CXCR5– CD8 T cells from six Mamu A01+ SIV-infected low-VL RMs. (D) Expression of granzyme B and perforin on sorted CXCR5+ and CXCR5– CD8 T cells following a 5-d in vitro Tfh expansion assay (n = 6). **P < 0.01.
Fig. S4.
Fig. S4.
(A) Representative FACS plots showing TNF-α, IFN-γ, and IL-2 production by CXCR5+ and CXCR5– CD8 T cells in response to Gag CM9 stimulation at week 24 post-SIV infection in the blood of an SIV-infected low-VL RM in response to P11c (Gag CM9) peptide stimulation. (B) Representative FACS plots showing the expression of granzyme B and perforin on CXCR5+ and CXCR5– Gag CM9 tetramer+ CD8 T cells at week 24 postinfection in the LNs. (C) Tfh cell-limited expansion assay showing sorted unpulsed GC–Tfh cells as a control cultured alone and driven to expand with αCD3/CD28 stimulation with or without autologous sorted CXCR5+ and CXCR5– CD8 T cells from six Mamu A01+ SIV-infected low-VL RMs. (D) Representative FACS plots showing the coexpression of granzyme B and perforin on sorted CXCR5+ and CXCR5– Gag CM9+ CD8 T cells following a 5-d in vitro Tfh-limited expansion assay. (E) Representative FACS plots showing the expression of granzyme B on Tfh cells cultured with sorted CXCR5+ and CXCR5– CD8 T cells in the Tfh-limited expansion assay. (F) Plots showing the expression of PD-1 between SIV-specific CXCR5+ and CXCR5– CD8 T cells. CXCR5+ CD8 T cells tend to express higher levels of PD-1 in LNs at week 24 post-SIV infection.
Fig. 4.
Fig. 4.
Global gene expression analysis revealed distinct gene expression profile for CXCR5+ SIV-specific CD8 T cells. (A) Microarray analysis of sorted CXCR5+ and CXCR5– Gag CM9 tetramer+ CD8 T cells from the LNs of six vaccinated SIV-infected low-VL RMs. The color intensity for heat maps represents expression by CXCR5+ CD8 vs. CXCR5– CD8 T cells. (B) Representative histogram plots and scatter plots showing the expression of the indicated markers on naïve CD8 T cells (CD95–, CD45RA+), CXCR5– and CXCR5+ Gag CM9 tetramer+ CD8 T cells, and Tfh cells. *P < 0.05.
Fig. 5.
Fig. 5.
Induction of CXCR5+ CD8 T cells can be enhanced in vitro. (A) CXCR5 expression on purified CXCR5+ or CXCR5– Gag CM9 tetramer+ CD8 T cells on day 5 following stimulation with anti-CD3 and anti-CD28 antibodies. (B) CXCR5 expression on total CD8 T cells on day 5 following stimulation with anti-CD3 and anti-CD28 antibodies in the presence of indicated cytokines (n = 3). (C) CXCR5 expression on sorted CXCR5+ and CXCR5– CD8 T cells on day 3 following stimulation with anti-CD3 and anti-CD28 antibodies in the presence of TGF-β (n = 3). **P < 0.01, ***P < 0.001.
Fig. S5.
Fig. S5.
(A) Representative FACS plots showing CXCR5 expression on purified total CXCR5+ or CXCR5– CD8 T cells following a 5-d proliferation assay with anti-CD3 and anti-CD28 antibodies (Left) and the frequency of CXCR5+ and CXCR5– CD8 T cells (% of CD8) (Right). (B) Temporal plasma VL (Left) and association between set point viremia and CXCR5 expression on SIV Gag CM9 tetramer+ CD8 T cells in blood at week 24 postinfection (chronic) in a group of unvaccinated SIV251-infected rhesus macaques. ***P < 0.001.

References

    1. Matano T, et al. Administration of an anti-CD8 monoclonal antibody interferes with the clearance of chimeric simian/human immunodeficiency virus during primary infections of rhesus macaques. J Virol. 1998;72(1):164–169. - PMC - PubMed
    1. Schmitz JE, et al. Control of viremia in simian immunodeficiency virus infection by CD8+ lymphocytes. Science. 1999;283(5403):857–860. - PubMed
    1. Jin X, et al. Dramatic rise in plasma viremia after CD8(+) T cell depletion in simian immunodeficiency virus-infected macaques. J Exp Med. 1999;189(6):991–998. - PMC - PubMed
    1. Borrow P, Lewicki H, Hahn BH, Shaw GM, Oldstone MB. Virus-specific CD8+ cytotoxic T-lymphocyte activity associated with control of viremia in primary human immunodeficiency virus type 1 infection. J Virol. 1994;68(9):6103–6110. - PMC - PubMed
    1. Migueles SA, et al. HIV-specific CD8+ T cell proliferation is coupled to perforin expression and is maintained in nonprogressors. Nat Immunol. 2002;3(11):1061–1068. - PubMed

Publication types

MeSH terms

Substances