Comparative Study
. 2017 Mar 15;198(6):2445-2456.
doi: 10.4049/jimmunol.1601453. Epub 2017 Feb 3.

IL-2 Modulates the TCR Signaling Threshold for CD8 but Not CD4 T Cell Proliferation on a Single-Cell Level

Affiliations
Comparative Study

IL-2 Modulates the TCR Signaling Threshold for CD8 but Not CD4 T Cell Proliferation on a Single-Cell Level

Byron B Au-Yeung et al. J Immunol. .

Abstract

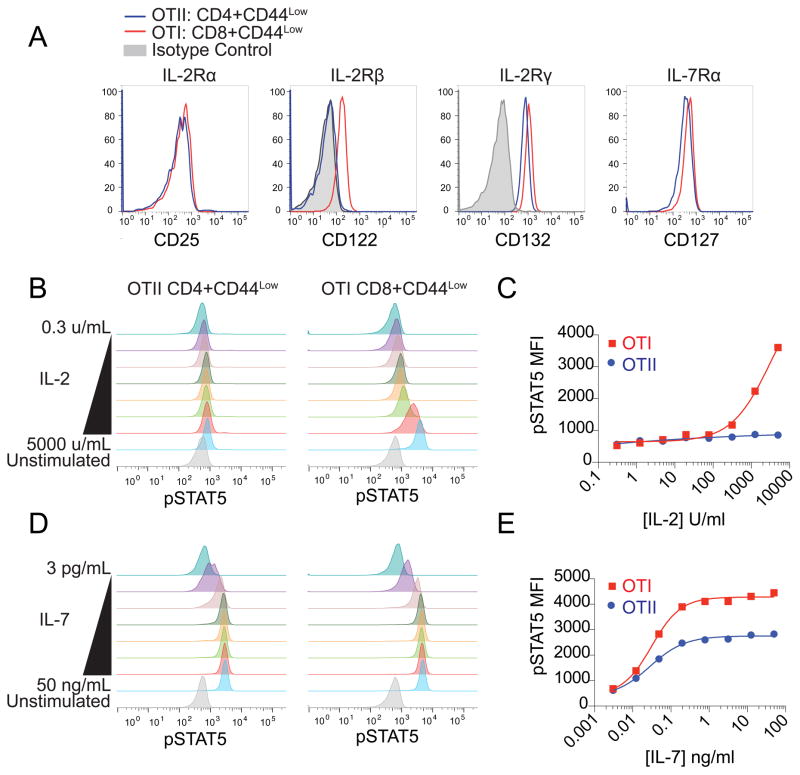
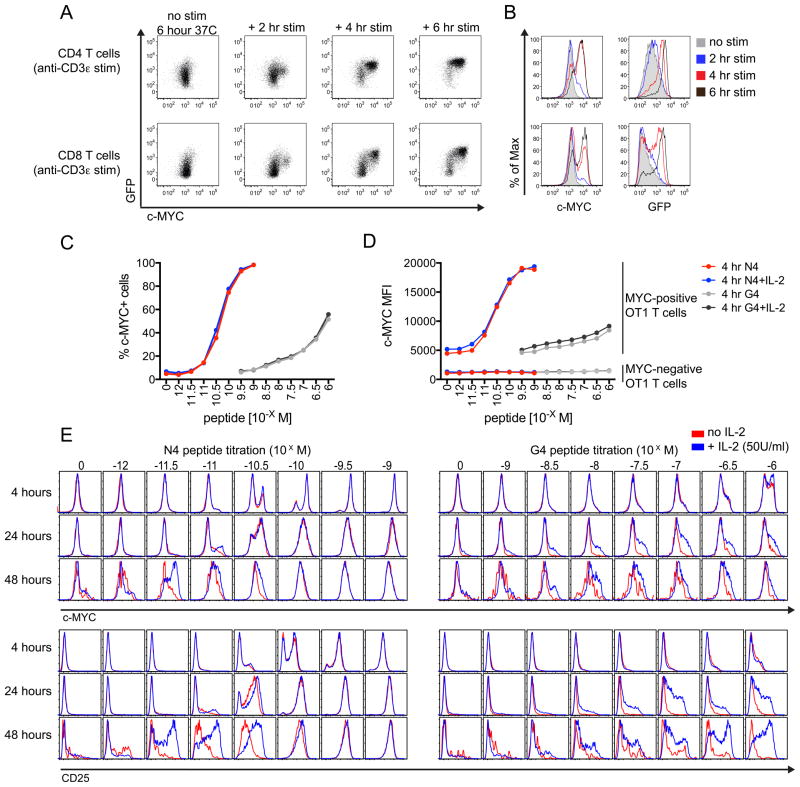
Lymphocytes integrate Ag and cytokine receptor signals to make cell fate decisions. Using a specific reporter of TCR signaling that is insensitive to cytokine signaling, Nur77-eGFP, we identify a sharp, minimal threshold of cumulative TCR signaling required for proliferation in CD4 and CD8 T cells that is independent of both Ag concentration and affinity. Unexpectedly, IL-2 reduces this threshold in CD8 but not CD4 T cells, suggesting that integration of multiple mitogenic inputs may alter the minimal requirement for TCR signaling in CD8 T cells. Neither naive CD4 nor naive CD8 T cells are responsive to low doses of IL-2. We show that activated CD8 T cells become responsive to low doses of IL-2 more quickly than CD4 T cells, and propose that this relative delay in turn accounts for the differential effects of IL-2 on the minimal TCR signaling threshold for proliferation in these populations. In contrast to Nur77-eGFP, c-Myc protein expression integrates mitogenic signals downstream of both IL-2 and the TCR, yet marks an invariant minimal threshold of cumulative mitogenic stimulation required for cell division. Our work provides a conceptual framework for understanding the regulation of clonal expansion of CD8 T cells by subthreshold TCR signaling in the context of mitogenic IL-2 signals, thereby rendering CD8 T cells exquisitely dependent upon environmental cues. Conversely, CD4 T cell proliferation requires an invariant minimal intensity of TCR signaling that is not modulated by IL-2, thereby restricting responses to low-affinity or low-abundance self-antigens even in the context of an inflammatory milieu.


Figures

Fig. 1
Fig. 1. A sharp TCR signaling threshold for CD8 T cell proliferation is independent of antigen affinity in vivo
A–C. Purified Nur77-eGFP OTI CD8 T cells were incubated in vitro with peptide-pulsed splenic APCs for 24 hours, and GFP expression was assessed by FACS. (A) Histograms depict GFP distribution among stimulated CD8+ T cells. (B) Graphs depict % live CD8 T cells that have upregulated GFP above baseline, as gated above, (C) and GFP MFI in live CD8 T cells. Data is representative of 3 independent experiments. D–E. Purified CellTrace Violet-loaded Nur77-eGFP OTI CD8 T cells were adoptively transferred into host CD45.1+ BoyJ mice, followed 24 hours later by adoptive transfer of peptide-loaded APCs (pulsed with 10−8 M N4, Q4R7, or G4). Splenocytes were harvested after 72 hours, surface stained to detect TCR Va2, CD45.1, CD45.2, and CD8 expression, and analyzed by FACS to detect GFP expression, CellTrace Violet dilution, and surface marker expression. (D) Plots and histograms depict GFP and CellTrace Violet expression in transferred CD8 T cells. (E, F) Graphs depict quantification of GFP MFI and/or CellTrace Violet (CTV) in CD8 T cells gated on the basis of cell division +/− SEM. Data in D–F reflects 3 biological replicates per peptide condition.
Fig. 2
Fig. 2. IL-2 but not antigen affinity or dose modulates the TCR signaling threshold for CD8 T cell proliferation in vitro
A–C. Purified Nur77-eGFP OTI CD8 T cells were loaded with CellTrace Violet and incubated in vitro with peptide-pulsed splenic APCs for 24 hours in the presence or absence of 50U/ml rhIL-2. After 72 hours, cells were stained to detect CD8 and CD25 expression. (A) Graphs depict division index of CD8 T cells cultured with different concentrations of peptides ± IL-2. (B) Plots and histograms depict GFP and CellTrace Violet expression in cultured CD8 T cells. (C) Graph depicts GFP MFI in CD8 T cells that had undergone one cell division at time of harvest under different peptide and cytokine conditions. All data are representative of at least N=3 independent experiments.
Fig. 3
Fig. 3. JAK3 blockade raises the TCR signaling threshold for proliferation, while IL-2 and IL-15 reduce it in CD8 T cells
A, B. Purified OTI-Nur77-GFP T-cells were incubated with peptide pulsed splenocytes from TCRα−/− mice for 3 days in the presence of DMSO or JAK3i (250 nM) and subsequently stained for CD8 and CD25. (A) Plots and histograms depict CellTrace Violet dilution, Nur77GFP and CD25 levels in titrations of N4 peptide. (B) Median Nur77-GFP of cells completing one division. Data are representative of two independent experiments. C. Purified Nur77-eGFP OTI CD8 T cells were loaded with CellTrace Violet and cultured with peptide-pulsed splenic APCs mice for 72 hours in the presence or absence of 50U/ml rhIL-2, or 100 ng/ml IL-15. Plots and histograms depict GFP, CD25, and CellTrace Violet expression in cultured CD8 T cells. Data are representative of two independent experiments.
Fig. 4
Fig. 4. Neither IL-2 nor antigen affinity modulates the TCR signaling threshold for AND Tg CD4 T cell proliferation in vitro
A, B. Purified Nur77-eGFP AND CD4 T cells were incubated in vitro with peptide-pulsed splenocytes from C3H mice for 24 hours in the presence of either anti-mouse IL-2 or 50U/ml rhIL-2, and subsequently stained to detect CD4 and CD25 expression. A. Graphs depict GFP or (B) CD25 MFI in live CD8 T cells. C–F. Purified Nur77-eGFP AND TCR Tg CD4 T cells were loaded with CellTrace Violet and cultured as described above for 72 hours and subsequently stained to detect CD4 and CD25 expression. (C) Plots and histograms depict GFP and CellTrace Violet expression in cultured CD4 T cells. (D, E) Graphs depicts GFP MFI in CD4 T cells that had undergone either no cell divisions or one cell division at time of harvest under different peptide and cytokine conditions. (F) Graph depicts CD25 MFI in bulk CD4 T cells cultured under different peptide conditions and cytokine conditions. All data are representative of at least N=3 independent experiments.
Fig. 5
Fig. 5. Naive CD4 and CD8 T cells cannot respond to low dose IL-2
A–E. Purified CD8 and CD4 T cells from OTI and OTII mice respectively were mixed together. (A) Mixed cells were stained to detect CD62LhiCD44low naïve CD8+ (red) and CD4+ T cells (blue) as well as surface expression of CD25, CD122, CD132 and CD127. Gray-shaded histograms represent isotype control. (B–E) Mixed cells were stimulated with a range of IL-2 or IL-7 concentrations for 15 minutes, fixed, and stained to detect intracellular pSTAT5 as well as CD44, Foxp3, CD4 and CD8 expression. (B, D) Histograms represent pSTAT5 expression in naïve CD4 or CD8 T cells gated to exclude Foxp3+ Tregs. (C, E) Graphs depict quantification of pSTAT5 from histograms in (B, D). All data are representative of at least N=2 independent experiments.
Fig. 6
Fig. 6. Activated CD8 and CD4 T cells exhibit differential capacity to signal in response to low dose IL-2
A–D. Purified CD8 and CD4 T cells depleted of Tregs were cultured for 24 hours with or without plate-bound anti-CD3ε 0.5μg/ml and neutralizing anti-IL-2 blocking antibody. (A) Cells were then stained to detect surface expression of CD25, CD122, and CD132. Graphs depict MFI for the IL-2 chains in cells cultured in media alone or after 24 hours of stimulation. B–D. Anti-CD3ε-stimulated cells were mixed, stimulated for 15 minutes with varying doses of rhIL-2, and fixed. Samples were then stained to detect CD25, CD4, CD8 and intra-cellular pSTAT5 expression. (B) Plot depicts gating on CD25 hi and lo populations within the CD4+CD8− and CD4−CD8+ populations. (C) Histograms represent pSTAT5 expression induced by varying doses of IL-2 in gated populations. (D) Graphs depict quantification of pSTAT5 from histograms in (C). All data are representative of at least N=5 independent experiments.
Fig. 7
Fig. 7. c-Myc protein is upregulated rapidly in response to antigen receptor signaling, and sustained by IL-2
A, B. Nur77-eGFP splenocytes were stimulated with platebound 5μg/ml anti-CD3e for 0, 2, 4, or 6 hours in vitro, and subsequently fixed, permeabilized, and stained to detect intra-cellular c-Myc protein as well as CD4 and CD8. Plots (A) and histograms (B) depict GFP and c-myc expression in CD4, CD8, and B220+ B cells stimulated as described above. (C–E) OTI lymphocytes were cultured with varying concentrations of N4 or G4 peptides with or without rhIL-2 50U/ml for 4, 24, or 48 hours, and subsequently fixed, permeabilized, and stained to detect intra-cellular c-Myc protein as well as CD8 and CD25 expression. (C) Graph depicts % CD8 T cells that had upregulated c-Myc protein under various culture conditions after 4 hours. (D) Graph depicts c-Myc MFI in CD8 T cells that had upregulated c-Myc or had not. (E) Histograms depict either c-Myc (top panels) or CD25 surface expression (bottom panels) in CD8 T cells cultured as described above. All data are representative of at least 3 independent experiments.
Figure 8
Figure 8. C-Myc expression marks an invariant threshold for T cell proliferation
Nur77-eGFP OTI lymphocytes were loaded with CellTrace Violet and cultured with varying concentrations of N4 or G4 peptides with or without rhIL-2 50U/ml for 72 hours, and subsequently fixed, permeabilized, and stained to detect intra-cellular c-Myc protein as well as CD8 and CD25 expression. (A, B) Plots depict CD25, c-myc, GFP, and/or CellTrace Violet from CD8 T cells cultured as described above. (C, D) Graphs depict GFP MFI (C) or c-Myc MFI (D) in CD8+ T cells that had undergone 1 cell division at time of harvest. All data in this figure are representative of at least 2 independent experiments.
Figure 9
Figure 9. Figure S4. Model of signaling thresholds for antigen-dependent lymphocyte proliferation
A. CD4 T cells upregulate IL-2Rα (CD25) in response to TCR signaling, but at early time points are refractory to low dose IL-2 stimulation despite CD25 expression. Thus c-myc induction and proliferation are dependent upon a robust minimal amount of TCR signaling that is not modulated by the presence of exogenous IL-2. (B) CD8 T cells also upregulate IL-2Rα in response to TCR signaling, and are consequently able to respond to low doses of IL-2, which further boosts IL-2Rα expression. This imposes a positive feedback loop that permits CD8 T cells to mount synergistic proliferative responses to extremely weak TCR stimuli in the presence of IL-2, but remain dependent upon a minimal amount of TCR signal to trigger the positive feedback. (C–E) Because Nur77-eGFP expression is a specific reporter of cumulative AgR signaling but is insensitive to cytokine signaling, (C) CD4 T cell populations treated with either low (red histogram) or high (blue histogram) TCR stimulation express different distribution of Nur77-eGFP after 24 hours irrespective of IL-2 treatment. Our model predicts that only T cells expressing GFP above a minimal threshold (i.e. only those cells that have integrated cumulative TCR signaling sufficient to drive a minimal amount of reporter expression) are able to proliferate, regardless of peptide or IL-2 input. (D, E) All divided CD4 T cells express GFP above this threshold irrespective of IL-2 supplementation. (A) We argue that this is due to insensitivity of CD4 T cells to low dose IL-2 signaling at early time points despite high CD25 induction. (F–H) CD8 T cells also express low or high amounts of Nur77-eGFP depending upon strength of AgR stimulation, and require high cumulative AgR signaling in order to proliferate. However, because CD8 T cells are responsive at early time points to co-stimuli, the minimal amount of AgR signaling required for proliferation is reduced by co-stimulation. (G, H) This model predicts that under these conditions even lymphocytes expressing low levels of Nur77-eGFP can divide, and is supported by our findings that costimulation indeed results in dividing lymphocytes expressing lower Nur77-eGFP expression. (I–K) Finally, we propose that c-Myc protein expression is regulated by both AgR and cytokine mitogenic inputs, and marks a threshold for minimal cumulative mitogenic stimulation required for proliferation. (J, K) This model predicts that c-Myc protein expression among dividing lymphocytes conforms to a minimal threshold that is independent of modulation of individual input signals, consistent with our observations.

References

    1. Arens R, Schoenberger SP. Plasticity in programming of effector and memory CD8 T-cell formation. Immunological reviews. 2010;235:190–205. - PMC - PubMed
    1. Marchingo JM, Kan A, Sutherland RM, Duffy KR, Wellard CJ, Belz GT, Lew AM, Dowling MR, Heinzel S, Hodgkin PD. T cell signaling. Antigen affinity, costimulation, and cytokine inputs sum linearly to amplify T cell expansion. Science (New York, NY) 2014;346:1123–1127. - PubMed
    1. Rochman Y, Spolski R, Leonard WJ. New insights into the regulation of T cells by gamma(c) family cytokines. Nature reviews Immunology. 2009;9:480–490. - PMC - PubMed
    1. Moran AE, Holzapfel KL, Xing Y, Cunningham NR, Maltzman JS, Punt J, Hogquist KA. T cell receptor signal strength in Treg and iNKT cell development demonstrated by a novel fluorescent reporter mouse. J Exp Med. 2011;208:1279–1289. - PMC - PubMed
    1. Mueller J, Matloubian M, Zikherman J. Cutting Edge: An In Vivo Reporter Reveals Active B Cell Receptor Signaling in the Germinal Center. The Journal of Immunology 2015 - PMC - PubMed

Publication types

MeSH terms

Substances