. 2017 Mar 21;8(12):19684-19698.
doi: 10.18632/oncotarget.14962.

A novel PHD-finger protein 14/KIF4A complex overexpressed in lung cancer is involved in cell mitosis regulation and tumorigenesis

Affiliations

A novel PHD-finger protein 14/KIF4A complex overexpressed in lung cancer is involved in cell mitosis regulation and tumorigenesis

Lin Zhang et al. Oncotarget. .

Abstract

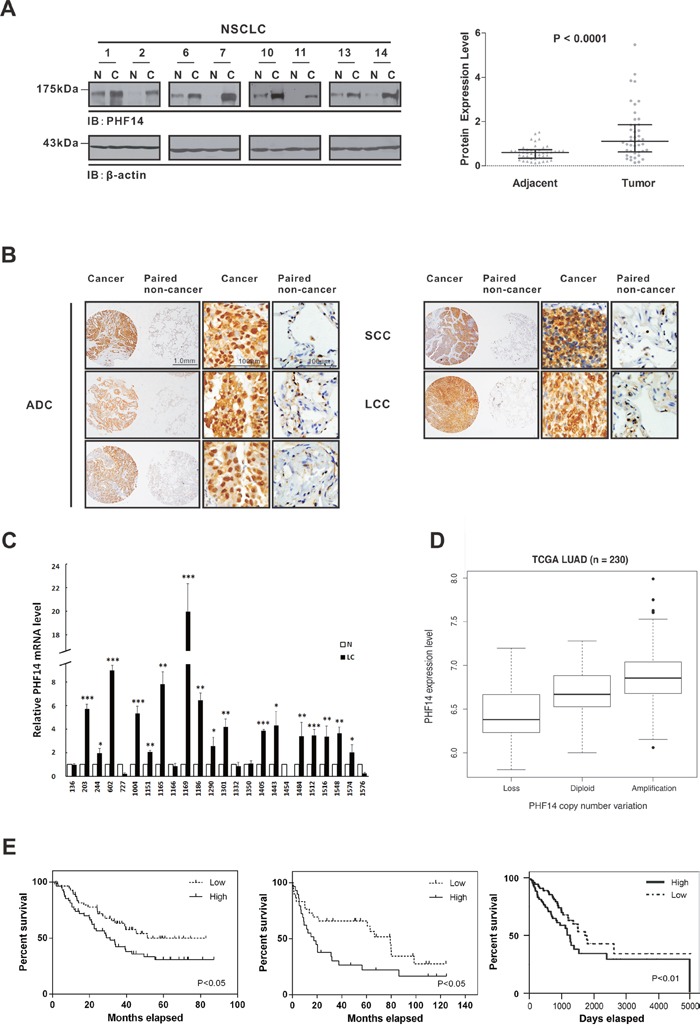
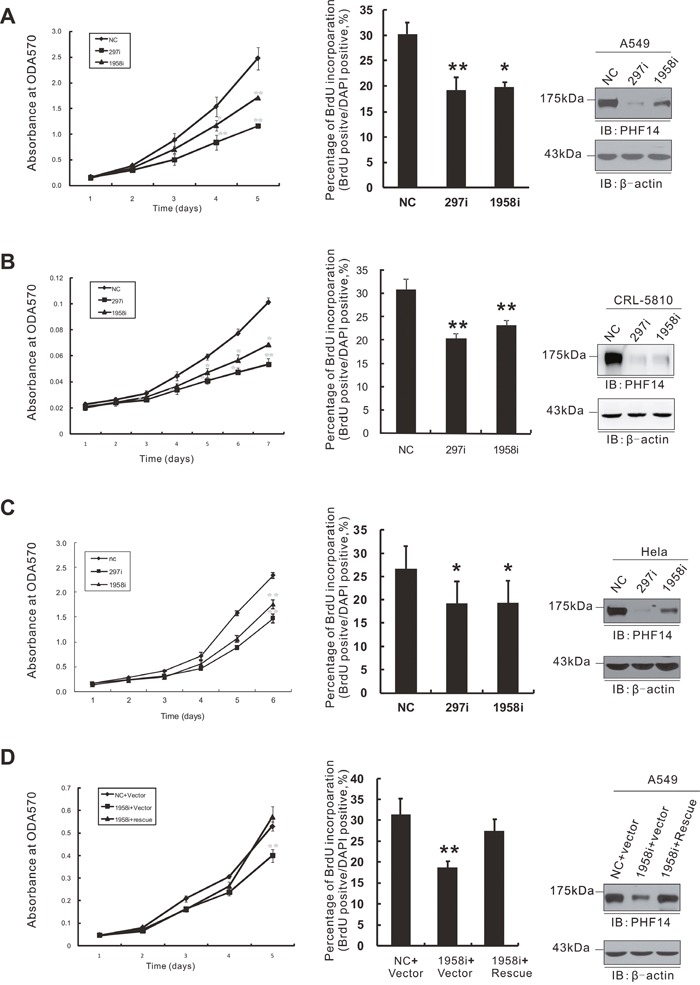
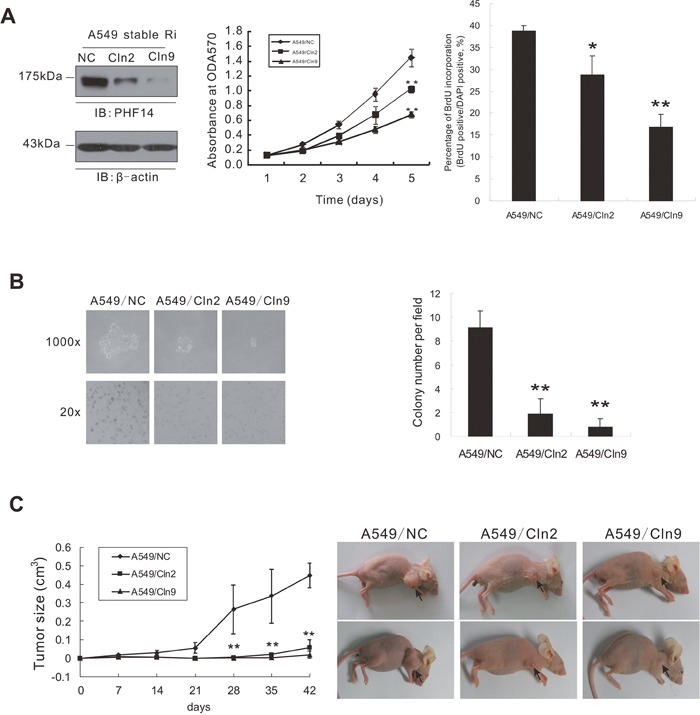
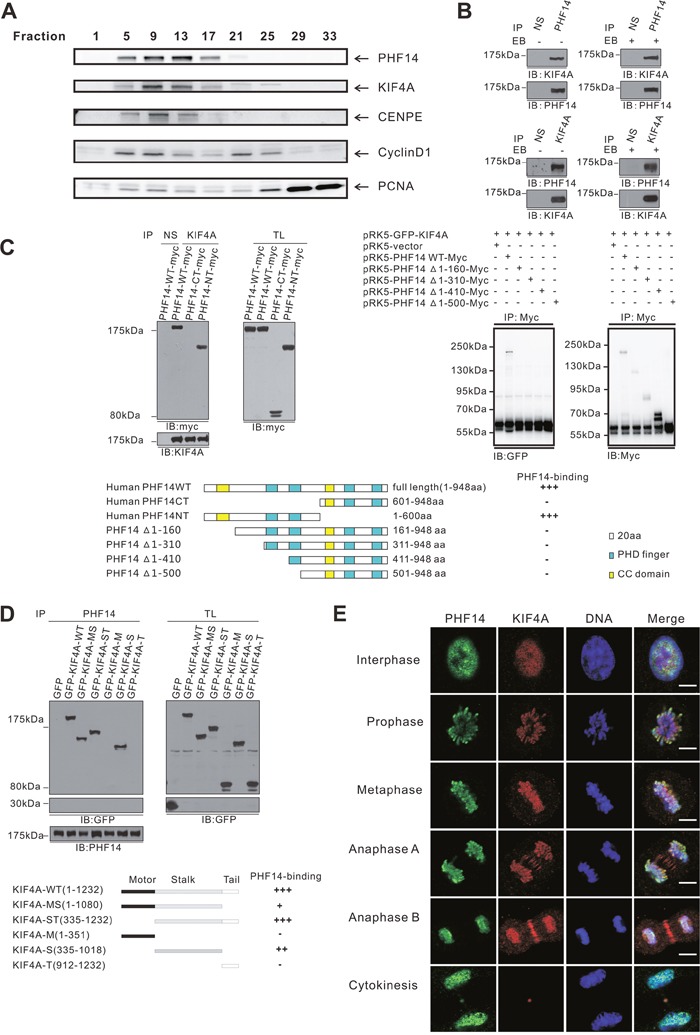
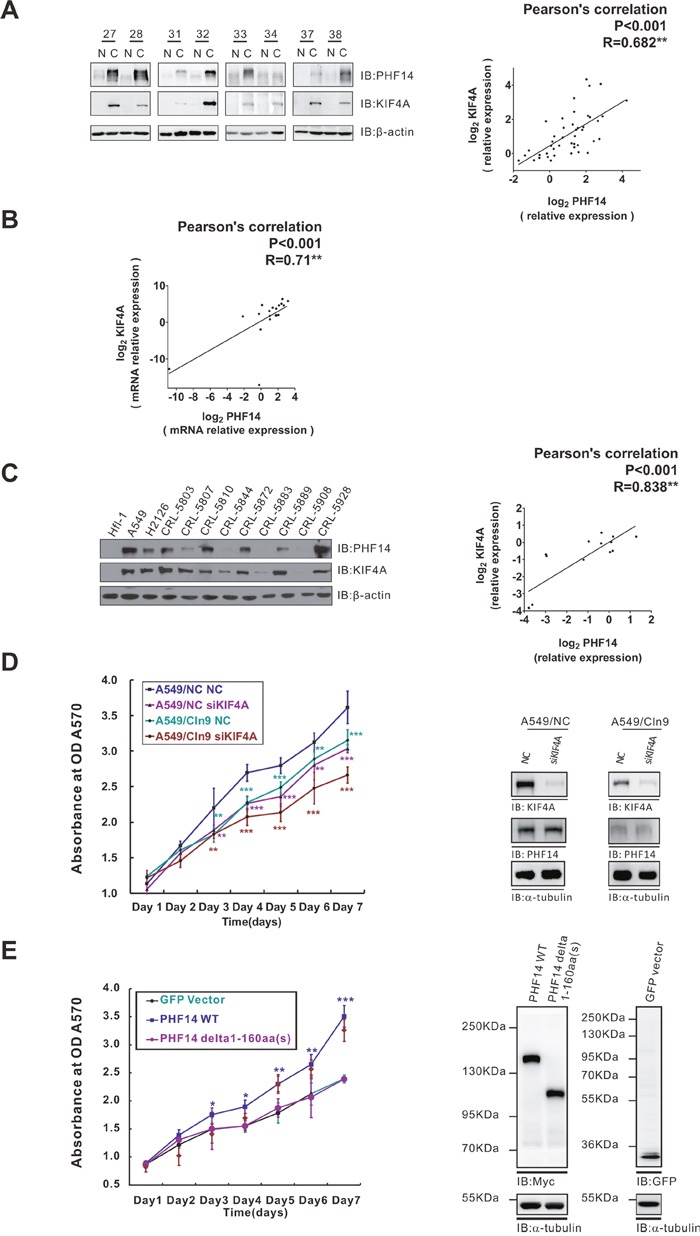
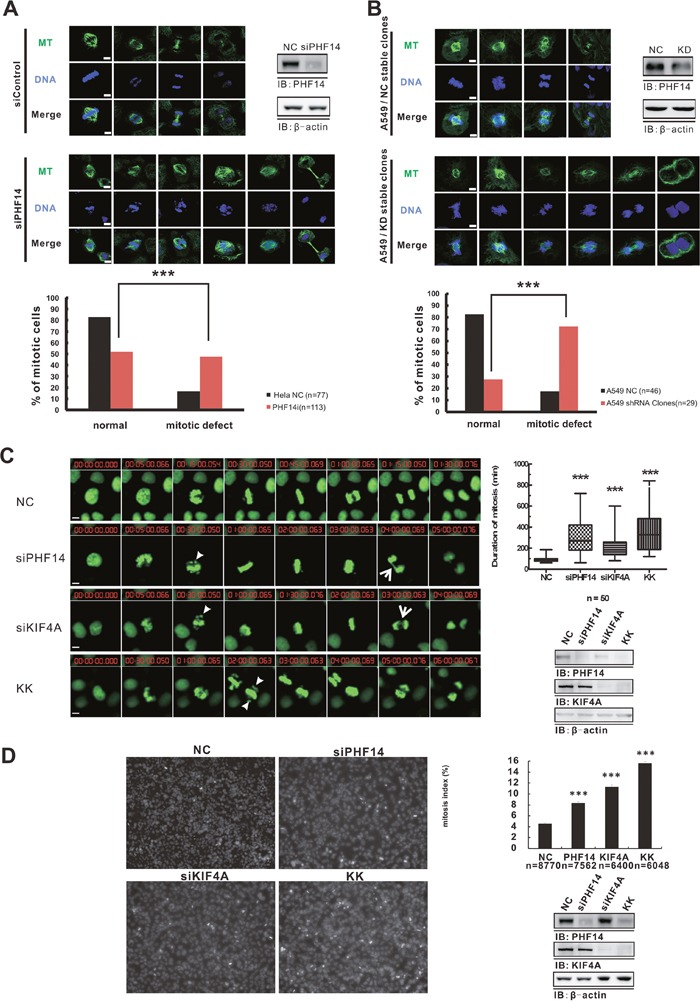
The plant homeodomain (PHD) finger-containing proteins have been implicated in many human diseases including cancer. In this study, we found that PHF14, a newly identified PHD finger protein, is highly expressed in lung cancer. The high expression level of PHF14 was associated with adenocarcinoma and poor survival in lung cancer patients. Knocking down PHF14 suppressed cancer cell growth and carcinogenesis, while over-expressing PHF14 promoted cell proliferation. During cell division, PHF14 directly bound to and co-localized with KIF4A (a nuclear motor protein involved in lung carcinogenesis) to form a functional complex. Similarly to the effect of KIF4A depletion, silencing PHF14 in several cell lines caused cell mitotic defects, prolonged M phase, and inhibited cell proliferation. What's more, these two proteins had a synergistic effect on cell proliferation and were significantly co-overexpressed in lung cancer tissues. Our data provide new insights into the biological significance of PHD finger proteins and imply that PHF14 may be a potential biomarker for lung cancer.

Keywords: KIF4A; PHF14; biomarker; lung carcinogenesis; mitosis.


Conflict of interest statement

CONFLICTS OF INTEREST

The authors declare no conflicts of interest.

Figures

Figure 1
Figure 1. Upregulation of PHF14 in lung cancer is significantly associated with poor prognosis
A. PHF14 expression in paired NSCLC samples (n=44). Left panel: representative images of western blots showing PHF14 expression in the NSCLC and adjacent tissues. β-actin was used for normalization. Right panel: statistical analysis of the relative PHF14 protein expression levels in the NSCLC and adjacent tissues. B. Representative images of immunohistochemical tissue arrays showing PHF14 expression in different types of NSCLC and adjacent tissues. ADC, adenocarcinoma; SCC, squamous cell carcinoma; LCC, large cell carcinoma. C. PHF14 mRNA levels in paired lung adenocarcinoma specimens (n=24). Differences between N (normal) and LC (lung cancer) were analyzed. D. Expression levels of PHF14 in lung adenocarcinoma are associated with gene copy numbers. Boxplot of PHF14 expression distribution in the sub-categorized adenocarcinoma patients based on PHF14 CNV (Copy Number Variation): Loss, Diploid and Amplification. The gene expression and CNV information was determined using RNA-seq and DNA-seq on the same cohort of 230 patients. Welch Two Sample t-test was used to compare the expression levels of PHF14 in subcategories. Amplification v.s. Diploid P=5.016e-06; Diploid v.s. Loss P=0.01473; Amplification v.s. Loss P=0.0003634. E. Kaplan-Meier survival curves of lung cancer patients corresponding to the PHF14 expression levels. The gene expression profiles were retrieved from GSE3141 (left panel, 111 samples) [34], GSE19188 (middle panel, 59 male subjects) [35] and TCGA database (right panel, 257 samples). The patients were categorized into two groups based on PHF14 expression level. “High” indicates that the expression level is higher than the samples’ median level; “Low” indicates lower. The log-rank test was used to compare the survival distributions of the two groups.
Figure 2
Figure 2. Knockdown of PHF14 inhibited cell proliferation
Cell proliferation of PHF14-transiently knocked down A549 A., CRL-5810 B. and HeLa C. cells. D. Expression of siRNA-resistant PHF14 rescued the inhibitory effect of PHF14 RNAi. Left panels: results of the MTT assay performed in control cells and different PHF14-knockdown cells. Middle panels: statistical analysis of BrdU incorporation assay. Right panels: western blot analysis showing the efficiency of PHF14 knockdown and the expression level of siRNA-resistant PHF14 in the indicated cells. β-actin was used as a loading control. NC, non-targeting control siRNA-transfected cells; 297i, PHF14-297i siRNA-transfected cells; 1958i, PHF14-1958i siRNA-transfected cells. Data are shown as the mean values from three independent experiments ± s.d. (standard deviation). * P<0.05, ** P<0.01.
Figure 3
Figure 3. Stable knockdown of PHF14 in A549 cells inhibited tumorigenicity of lung cancer cells
A. Cell proliferation of PHF14-stable knockdown A549 cells. Left panel: western blot analysis showing the efficiency of PHF14 knockdown in the indicated cells. β-actin was used as the loading control. Middle panel: results of the MTT assay performed in control cells and PHF14 stable knockdown clones. Right panel: BrdU incorporation assay. B. Soft agar assay. Cells were grown in soft agar culture medium for 15 days, and colonies (≥50 cells) were counted under a microscope. Left panel: representative images showing colony formation in soft agar. Right panel: colony numbers are presented as the mean value ± s.d. C. Tumor formation in nude mice. Left panel: Average tumor size in the mice injected with different cells as indicated. The mean value ± s.d. was calculated from four animals in each group. Right panel: representative images showing tumor formation in nude mice.* P<0.05, ** P<0.01.
Figure 4
Figure 4. PHF14 and KIF4A formed a physical complex and co-localized extensively in the nucleus during mitosis
A. FPLC strategy to identify protein complexes in nuclear extract from HeLa cells. PHF14, KIF4A, CENPE, and Cyclin D1 were detected in the same fractionations using western blotting analysis. B. Co-immunoprecipitation of endogenous PHF14 and KIF4A in A549 cells. C. and D. Mapping of the interaction site between PHF14 and KIF4A. Upper panels of (C): co-immunoprecipitation analysis of myc-tagged PHF14 or its mutants with GFP-tagged WT KIF4A. Myc-PHF14 or its mutants and GFP-KIF4A were co-overexpressed in HCT-116 cells. Lower panels of (C): schematic representation of PHF14 mutants. Upper panel of (D): co-immunoprecipitation analysis of GFP-tagged WT KIF4A or deletion mutants with PHF14. GFP-tagged WT KIF4A or deletion mutants were expressed in 293T cells. Lower panel of (D): schematic representation of KIF4Amutants. The affinity of the binding was rated as follows: +++: intensive; ++: moderate; +: weak; -: binding not detectable. E. Co-localization of endogenous PHF14 and KIF4A in A549 cells. A549 cells were stained with anti-PHF14 antibodies (green), anti-KIF4A antibodies (red) and DAPI (DNA, blue). Scale bar = 5 μm.
Figure 5
Figure 5. PHF14 co-overexpressed with KIF4A and they have a synergistic effect on cell proliferation
A. PHF14 and KIF4A expression in paired NSCLC samples. Left panel: representative western blot results showing that PHF14 and KIF4A are co-upregulated in NSCLC specimens. β-actin was used as a loading control. Right panel: Pearson's correlation analysis showing a significant positive correlation between PHF14 expression and KIF4A expression in NSCLC specimens (n=44). R=0.682, P<0.001. B. The correlation between PHF14 and KIF4A mRNA expression levels in paired NSCLC samples. Data obtained from qPCR results, n=24, R=0.71, P<0.001. C. PHF14 and KIF4A expression in NSCLC cell lines. Left panel: western blot results showing that PHF14 and KIF4A are co-upregulated in NSCLC cell lines. A human fetal lung fibroblast (HFL) was used as a control. β-actin was used as a loading control. Right panel: significant positive correlation between PHF14 expression and KIF4A expression in NSCLC cells. R=0.838, P<0.001. D. The effect of PHF14 and/or KIF4A depletion on A549 cell proliferation. E. The effect of overexpressing PHF14 WT or PHF14 NT 1-160a.a truncated mutant on HCT-116 cell proliferation. Left panel: results of the MTT assay. Right panels: western blot analysis showing the knockdown efficiency of different siRNAs and efficiency of the overexpression of different constructs. α-tubulin was used as the loading control. * P<0.05, ** P<0.01, *** P<0.001.
Figure 6
Figure 6. Depletion of PHF14 and KIF4A induced mitotic defects
Chromosome and spindle morphology defects during mitosis in PHF14-depleted HeLa cells A. and PHF14-depleted A549 cells B. Upper panels: cells were stained with anti-tubulin (green) and DAPI (DNA, blue) to reveal the spindle and the chromosome. Chromosome misalignment, anaphase separation incompletion, and spindle defects of the distinct mitotic cells can be seen in PHF14-depleted cells. Bar, 5μm. Lower panels: statistics of mitotic phenotypes. C. The effect of PHF14 and/or KIF4A depletion on mitosis in HeLa cells. Left panel: representative images from time-lapse movies. HeLa cells stably expressing histone H2B-GFP (green) were transfected with control siRNA (NC), PHF14 siRNA (siPHF14), KIF4A siRNA (siKIF4A) or PHF14/KIF4A siRNA (KK). Bar, 5 μm. Arrowheads indicate mis-aligned chromosomes and arrows indicate incomplete-separated chromosomes inPHF14RNAi and/or KIF4A RNAi cells. Upper right panel: quantitative analysis of the duration of the M phases of HeLa H2B-GFP cells after different siRNA treatments. Data from at least three different experiments are represented as box-and-whisker plots. D. Analysis of mitotic index in HeLa cells. Left panel: representative cell images of HeLa cells transfected with different siRNAs. Random images (9 images, 6,000–8,000 cells) were analyzed per experiment, and mitotic cells were identified in the 405 nm channel on the basis of their condensed DNA content. Upper right panel: the mitotic index was calculated and is presented as the mean ± s.d.; *** P<0.0001. n=number of analyzed cells. Lower right panels: western blot results showing the efficiency of PHF14 and/or KIF4A knockdown in the indicated cells. β-actin was used as the loading control.

Similar articles

Cited by

References

    1. Shi X, Hong T, Walter KL, Ewalt M, Michishita E, Hung T, Carney D, Pena P, Lan F, Kaadige MR, Lacoste N, Cayrou C, Davrazou F, et al. ING2 PHD domain links histone H3 lysine 4 methylation to active gene repression. Nature. 2006;442:96–99. - PMC - PubMed
    1. Wysocka J, Swigut T, Xiao H, Milne TA, Kwon SY, Landry J, Kauer M, Tackett AJ, Chait BT, Badenhorst P, Wu C, Allis CD. A PHD finger of NURF couples histone H3 lysine 4 trimethylation with chromatin remodelling. Nature. 2006;442:86–90. - PubMed
    1. Sanchez R, Zhou MM. The PHD finger: a versatile epigenome reader. Trends Biochem Sci. 2011;36:364–372. - PMC - PubMed
    1. Baker LA, Allis CD, Wang GG. PHD fingers in human diseases: disorders arising from misinterpreting epigenetic marks. Mutat Res. 2008;647:3–12. - PMC - PubMed
    1. Micci F, Gorunova L, Gatius S, Matias-Guiu X, Davidson B, Heim S, Panagopoulos L. MEAF6/PHF1 is a recurrent gene fusion in endometrial stromal sarcoma. Cancer Lett. 2014;347:75–78. - PubMed

MeSH terms