Review
. 2017 Oct 15:160:15-31.
doi: 10.1016/j.neuroimage.2017.01.079. Epub 2017 Feb 1.

Development of large-scale functional networks from birth to adulthood: A guide to the neuroimaging literature

Affiliations
Review

Development of large-scale functional networks from birth to adulthood: A guide to the neuroimaging literature

David S Grayson et al. Neuroimage. .

Abstract

The development of human cognition results from the emergence of coordinated activity between distant brain areas. Network science, combined with non-invasive functional imaging, has generated unprecedented insights regarding the adult brain's functional organization, and promises to help elucidate the development of functional architectures supporting complex behavior. Here we review what is known about functional network development from birth until adulthood, particularly as understood through the use of resting-state functional connectivity MRI (rs-fcMRI). We attempt to synthesize rs-fcMRI findings with other functional imaging techniques, with macro-scale structural connectivity, and with knowledge regarding the development of micro-scale structure. We highlight a number of outstanding conceptual and technical barriers that need to be addressed, as well as previous developmental findings that may need to be revisited. Finally, we discuss key areas ripe for future research in order to (1) better characterize normative developmental trajectories, (2) link these trajectories to biologic mechanistic events, as well as component behaviors and (3) better understand the clinical implications and pathophysiological basis of aberrant network development.

Keywords: Brain development; Connectomics; Functional connectivity; Graph theory; Resting-state functional MRI.


Figures

Figure 1
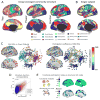
Figure 1. Crucial network properties of resting-state activity in the normal adult brain
A) Group-averaged community structure of resting state brain activity, densely sampled across the cortical surface, in three independent studies (Gordon et al., 2016; Power et al., 2011; Yeo et al., 2011). Different colors correspond to different modules with highly correlated activity, i.e. functional connectivity (FC). Several canonical modules appear in all three studies, including early visual, early somatomotor, default mode, dorsal attention, frontoparietal, and cingulo-opercular modules. Community structure is highly reproducible across these studies. The color scheme in Power and Gordon matches the legend, but differs in Yeo. A novel areal parcellation is also defined in Gordon, as evidenced by interareal boundaries. B) Community structure and areal parcellation of an individual subject (Laumann et al., 2015), obtained via repeated scanning sessions in the same individual. Community structure strongly resembles that of the group, although idiosyncracies are also clearly observable (see (Laumann et al., 2015)). C) Group-average resting-state network organization defined using 264 spherical nodes situated within different functional modules. On the left, the location and modular assignment of these nodes are pictured on the brain, next to a spring-embedded layout of the thresholded functional matrix. The network layout depicts nodes with stronger links (i.e. stronger correlations in activity) as closer together. The layout illustrates that network organization is heterogeneous – some modules are highly segregated from the rest of the network, whereas others are more integrated. On the right, the participation coefficient is quantified for each node. The participation coefficient signifies the extent to which a node integrates activity across multiple modules. Comparing the network layouts, integrator nodes tend to exist within the modules reflecting task-positive cognition, i.e. the frontoparietal, cingulo-opercular, and dorsal attention modules. See (Power et al., 2013). D) Structural connectivity shapes and constrains FC. As an example, this plot illustrates the correspondence between empirical FC (y-axis) and predicted FC (x-axis) based on modeling communication via the structural connectome. Dots represent region pairs that either are (blue) or are not (red) directly connected via fiber pathways. See (Goni et al., 2014). E) Structural hubs tend to interlink to each other and across functional modules, providing an anatomical substrate for integration between otherwise segregated domains of information processing. The schematic on the left illustrates this hypothesis, where the modules on top are functionally defined and the connections shown on the bottom reflect neuroanatomical links. The “rich club” nodes (shown in blue) reflect structural hubs that disproportionately connect to each other. On the right, evidence that the rich club serves an integrative function, as functional network nodes with high participation coefficient (i.e. high between-module integration) overlap significantly with the brain’s structural rich club. See (van den Heuvel and Sporns, 2013).
Figure 2
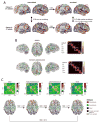
Figure 2. Infant brain structural and functional development
A) Visualizations of infant brain cortical surfaces at birth, 1 year, and 2 years of age. Large growth is clearly visible in terms of total brain size, cortical surface area, and cortical thickness Adapted from (Li et al., 2015). B) Resting-state functional connectivity network visualizations at birth, 1 year, and 2 years of age. The different lobes containing each region are labeled. Increasing separation of regions into functional modules spanning multiple lobes is apparent over this timespan. Adapted from (Gao et al., 2011). C) Community structure of 230 functional ROIs in 1–2 year olds (top) and in adults (bottom) using closely matched methods. Labeling of infant modules was informed via the adult set: Vis (visual), tDMN (temporal default mode network), pcDMN (posterior cingulate DMN), aDMN (anterior DMN), SMN (somato-motor network), SMN2 (somato-motor network 2), DAN (dorsal attention network), pFPC (posterior frontal parietal control network), aFPC (anterior frontal parietal control network), SubCtx (subcortex), CO (cingulo-opercular), pCO (posterior CO), and Sal (salience). Adapted from (Eggebrecht et al., 2017).
Figure 3
Figure 3. Development of functional architecture from childhood to adulthood: similarities in community structure across age
A) Illustration shows community structure of functional networks in childhood (top) and adulthood (bottom), with (right) or without (left) denoising of scans via removal of high head-motion frames (i.e. “scrubbing”). Nodes are 264 spherical ROIs, colored according to community assignments. Circles illustrate areas that show apparent age-related differences prior to motion denoising, but which do not demonstrate age effects after denoising. Numbers next to arrows indicate the mutual information (a graph theoretic measure of similarity) in the two community structures. Motion exaggerates age-related differences in community structure. From (Power et al., 2012). B) Similar community structure is obtained in adults and children when using strict criteria to minimize the influence of motion artifact. Overall network structure looks remarkably similar as well. From (Fair et al., 2012b). C) Similar community structures are identified in late childhood, early adolescence, late adolescence, and adulthood. On the other hand, there is evidence for refinement within this modular framework (see Figure 4). From (Marek et al., 2015).
Figure 4
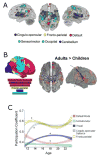
Figure 4. Evidence for disproportionate involvement of the cingulo-opercular and somatomotor systems during development from late childhood into adulthood
A)Regions that are most predictive of age, from late childhood to young adulthood, via age-related changes in functional connectivity. Nodes are sized according to predictive strength in a support-vector machine. Adapted from (Fair et al., 2012b). B) On the left, average functional community structure is shown for healthy young adults. On the right, differences in functional connectivity between adults and older children are shown. Adults have greater functional connectivity of selected links within and between the somoatomotor and cingulo-opercular modules. Regions on the cortical surface with high functional connectivity overall are highlighted in warm colors, illustrating that developmental differences also involve hub regions. Adapted from (Grayson et al., 2014). C) Developmental trajectories are illustrated for five networks. Average participation coefficient for nodes within each network are plotted over age. The cingulo-opercular network exhibited the most substantial increase over development. These changes mediated age-related increases in cognitive control and were especially driven by increased connectivity between cingulo-opercular and somatomotor nodes. From (Marek et al., 2015).
Figure 5
Figure 5. Functional network organization, hierarchies, and structure-function relationships in the monkey brain gleaned through contrast-enhanced resting-state imaging
A) Community detection performed on an 80-region parcellation of the rhesus monkey brain. Resting-state networks were obtained under anesthesia using enhanced imaging methodologies that included exogenous contrast, a surface coil with high SNR, and head fixation. Reported modules show clear homology with those seen in the human literature. B) Spring-embedded graph layout visualizing correlations between individual regions. Integrated versus segregated activity is visible, as are hierarchies within different sensory modalities. For instance, dorsal attention nodes are situated centrally, suggesting globally integrated processing. In contradistinction, primary visual, auditory, and somatosensory cortex are the most peripheral nodes within their respective modules, followed by secondary sensory cortices, suggesting both segregation of sensory streams and hierarchical relationships within them. Nodes are sized by their correlation with the global signal, illustrating that more central nodes have higher global signal correlation. C) Plot illustrates the correspondence between empirical FC (y-axis) and predicted FC (x-axis) based on modeling communication in the structural connectome. Dots represent region pairs that either are (blue) or are not (red) directly connected via fiber pathways. D) Structure-function relationships are also observable at the node level. Regional correlation with the global signal (y-axis) is associated with total communication capacity to and from the rest of the brain (x-axis). Dots show global signal correlations before (closed) and after (open) regressing out the global signal from each region’s timecourse. Adapted from (Grayson et al., 2016).

References

    1. Alcauter S, Lin W, Keith Smith J, Gilmore JH, Gao W. Consistent anterior-posterior segregation of the insula during the first 2 years of life. Cereb Cortex. 2015a;25:1176–1187. - PMC - PubMed
    1. Alcauter S, Lin W, Smith JK, Goldman BD, Reznick JS, Gilmore JH, Gao W. Frequency of spontaneous BOLD signal shifts during infancy and correlates with cognitive performance. Dev Cogn Neurosci. 2015b;12:40–50. - PMC - PubMed
    1. Allen EA, Damaraju E, Plis SM, Erhardt EB, Eichele T, Calhoun VD. Tracking whole-brain connectivity dynamics in the resting state. Cereb Cortex. 2014;24:663–676. - PMC - PubMed
    1. Alstott J, Breakspear M, Hagmann P, Cammoun L, Sporns O. Modeling the impact of lesions in the human brain. PLoS Comput Biol. 2009;5:e1000408. - PMC - PubMed
    1. Andoh J, Matsushita R, Zatorre RJ. Asymmetric Interhemispheric Transfer in the Auditory Network: Evidence from TMS, Resting-State fMRI, and Diffusion Imaging. J Neurosci. 2015;35:14602–14611. - PMC - PubMed

Publication types

LinkOut - more resources