Review
. 2017 Jun:39:71-81.
doi: 10.1016/j.mri.2017.01.020. Epub 2017 Feb 2.

Biophysical and neural basis of resting state functional connectivity: Evidence from non-human primates

Affiliations
Review

Biophysical and neural basis of resting state functional connectivity: Evidence from non-human primates

Li Min Chen et al. Magn Reson Imaging. 2017 Jun.

Abstract

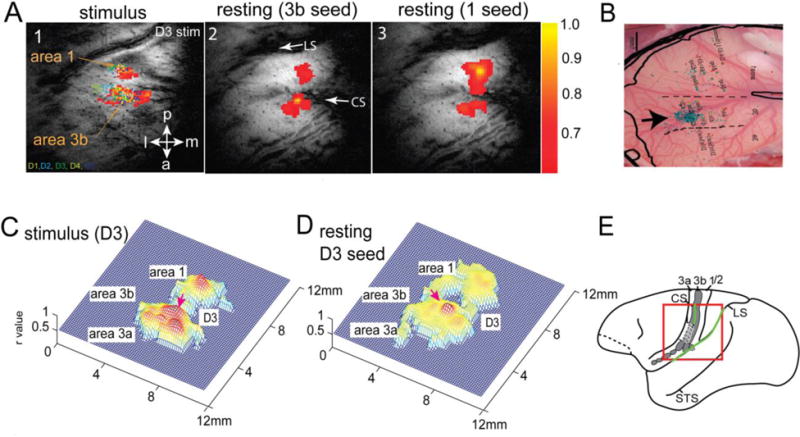
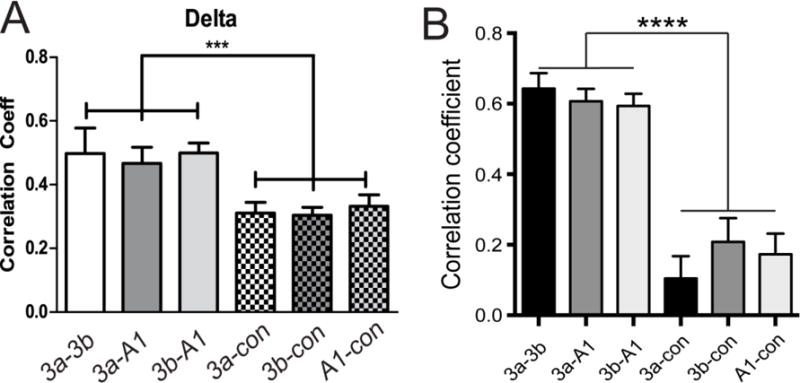
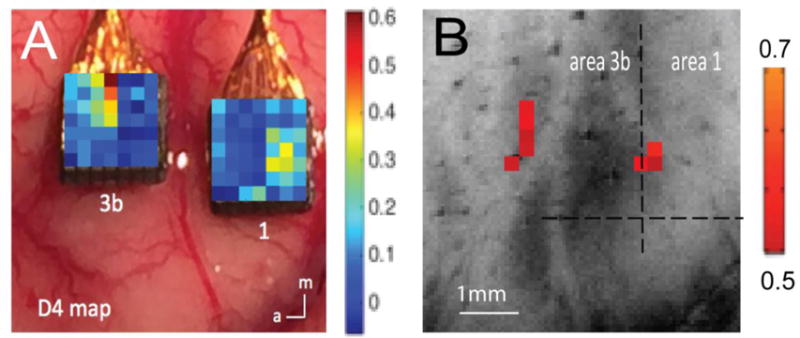
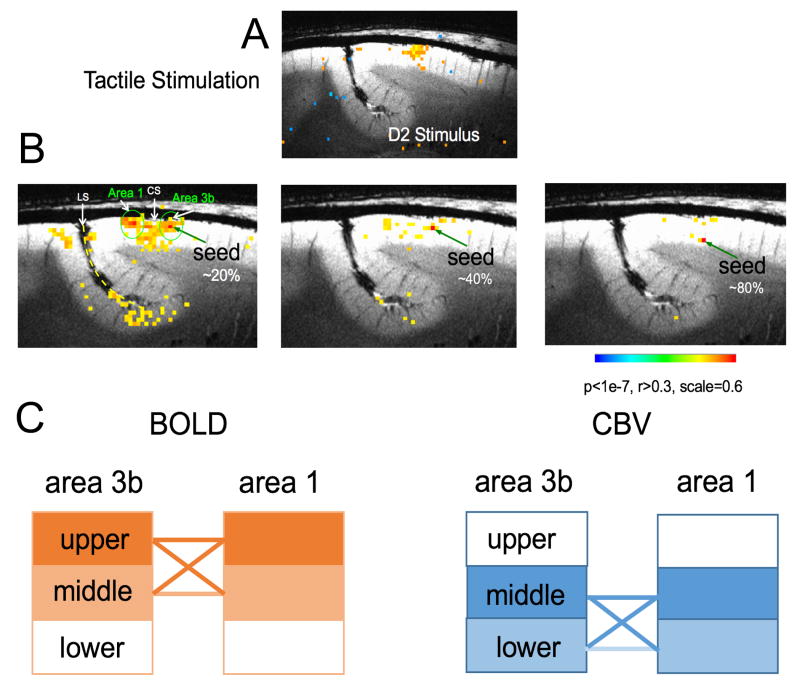
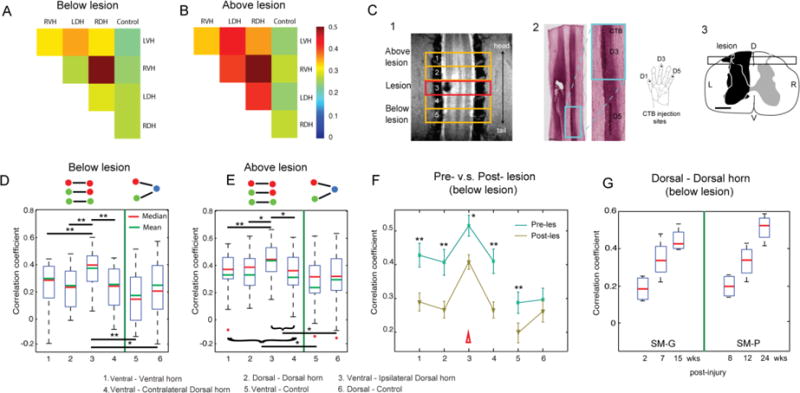
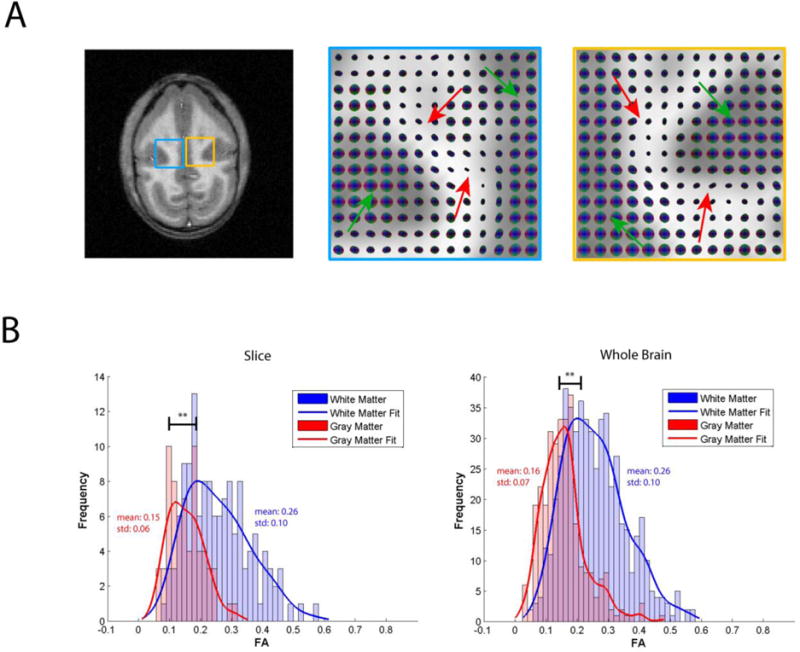
Functional MRI (fMRI) has evolved from simple observations of regional changes in MRI signals caused by cortical activity induced by a task or stimulus, to task-free acquisitions of images in a resting state. Such resting state signals contain low frequency fluctuations which may be correlated between voxels, and strongly correlated regions are deemed to reflect functional connectivity within synchronized circuits. Resting state functional connectivity (rsFC) measures have been widely adopted by the neuroscience community, and are being used and interpreted as indicators of intrinsic neural circuits and their functional states in a broad range of applications, both basic and clinical. However, there has been relatively little work reported that validates whether inter-regional correlations in resting state fluctuations of fMRI (rsfMRI) signals actually measure functional connectivity between brain regions, or to establish how MRI data correlate with other metrics of functional connectivity. In this mini-review, we summarize recent studies of rsFC within mesoscopic scale cortical networks (100μm-10mm) within a well defined functional region of primary somatosensory cortex (S1), as well as spinal cord and brain white matter in non-human primates, in which we have measured spatial patterns of resting state correlations and validated their interpretation with electrophysiological signals and anatomic connections. Moreover, we emphasize that low frequency correlations are a general feature of neural systems, as evidenced by their presence in the spinal cord as well as white matter. These studies demonstrate the valuable role of high field MRI and invasive measurements in an animal model to inform the interpretation of human imaging studies.

Keywords: Cortex; Monkey; Neuroimaging; Resting state; Spinal cord; White matter; fMRI.


Figures

Figure 1
Figure 1
Relationship between rs-FC and anatomical connection. (A1) BOLD activation map (resolution: 0.55×0.55×2mm3) elicited by 8Hz vibrotactile stimulation of digit 3 (D3). Color dots represent the receptive field (D1–D5) and microelectrode recording sites. (A2–3) Correlation maps (thresholded at r = 0.6) of seeds (yellow voxels) identified at the centers of area 3b (2) and area 1 activation foci. (B) BDA (Biotinylated dextran amines) tracer injection in area 3b (black arrow). Light blue patches are BDA labeled terminals. Receptive fields were used to determine the digit region for injection. (C–D) 3D plots of A1 and A2. (E) Schematic illustration of the imaging field of view (redline box) and location of S1 subregions (areas 3a, 3b, 1/2) on squirrel monkey brain outline. CS/LS: central and lateral sulci; STS: superior temporal sulcus. Modified from (28).
Figure 2
Figure 2
Inter-areal rsfMRI connectivity covaries with inter-areal correlations of delta, alpha, and gamma low bands of LFP signals within S1 cortex. (A) Functional connectivity measures between sub-regions of digit representation within S1 (3a–3b, 3a–A1, 3b–A1) and between S1 digit and face control (3a-con, 3b-con, A1-con) region for delta band LFPs. (B) The same correlation pattern for rsfMRI signals. Modified from (33).
Figure 3
Figure 3
Comparison of spatial profiles of BOLD and LFP signals to tactile stimulation. (A–B) Single digit tactile stimulation evoked LFP (A) and BOLD (B) responses (in % signal changes; see color bar for range) to tactile stimulation of digit 4 (D4). Modified from (42).
Figure 4
Figure 4
Layer-specific resting state functional connectivity (rsFC) between areas 3b and 1. (A) Tactile stimulus-evoked BOLD activation map (thresholded at t > 2.7). (B) Voxel-wise BOLD correlation maps of seeds in upper, middle, and lower layers (depths) of area 3b. Correlation maps are thresholded at r > 0.3. (C) Schematic illustration of the differences between CBV and BOLD inter-layer functional connectivities. Solid lines indicate the functional connections between layers are strong and significant. Modified from (47).
Figure 5
Figure 5
Differential inter-areal functional connectivity of resting state BOLD signals between digit-digit (3b-ar1, 3b-3a, 3a-ar1) and digit-face control (3b-cntr, ar1-cntr, 3a-cntr) region pairs (A) and the effects of different doses of isoflurane on inter-areal rsfMRI BOLD connectivity (B). Modified from (51).
Figure 6
Figure 6
Representative fMRI activations to tactile and nociceptive heat stimulation of two distal finger pads. (A) Multi-run average fMRI activations to tactile stimulation of two distal finger pads on left hand. (B) Multi-run average fMRI activations to 47.5 °C nociceptive heat stimulation of two distal finger pads on left hand. Hand inserts show the locations of stimulation. All activation maps are thresholded at p < 0.05 for multi-run with FDR (0.01) correction, see color scale bar on image 5 for the t value range. Images 1–5: from rostral to caudal. Scale bars indicate 1 mm. D: dorsal; V: ventral; L: left; R: right. Modified from (52).
Figure 7
Figure 7
Differential fMRI response magnitudes of four horns to touch versus nociceptive heat stimuli within a single spinal segment, and a schematic summary. (A, C) Time courses of fMRI signal changes to unilateral tactile (A) and nociceptive heat (C) stimulation of two distal finger pads in the iDH: ipsilateral dorsal horn; cDH: contralateral dorsal horn; iVH: ipsilateal ventral horn and cVH: contralateral ventral horn, and one white matter (WM) region. Color lines and shadows indicate mean ± standard error of the percentage fMRI signal changes. The red lines near the x-axis show the stimulation periods of 30 sec for tactile and 22 sec for heat, respectively. (B, D) Statistical comparisons of the group peak magnitudes of fMRI signal changes (mean ± standard error). *p < 0.05; *** p < 0.005; **** p < 0.001. (E, F). Schematic summarizing the differential activation patterns to touch (E) versus nociceptive heat (E) stimulation within and across (raw data not shown) spinal segments. Dark blue and red cones indicate responses are significant. Orange, green and magenta color cones indicate statistically different responses between touch and nociceptive heat. Modified from (52).
Figure 8
Figure 8
Reproducible functional connectivity pattern of the spinal cord horns. (A & B) Intra-(within) and inter-(across) slice correlation patterns of the seeds (indicated by yellow arrows) placed at the ventral horns on slice 3 in two representative normal animals. Correlation maps were thresholded at r > 0.30 (see color scale bar next to image column 5). (C) Intra- and inter-slice correlation pattern of one control seed in the white matter. (D) 3-D illustration of the t-statistic of the correlation map of the right ventral horn at the group level (15 runs from 5 animals). (E) Corresponding contour map of the group correlation pattern at three different t-statistics (blue: t=5; light blue: t=6.5; red: t=9). The left ventral horn in slice 3 in one subject was used as the point of interest for manual co-registration in the group analysis. (F) Overlay of the thresholded (red patch) correlation map of left ventral horn seed on the mean intensity map of the spinal cord MTC images. (G) 3D reconstruction of the correlation map from the sample case shown in A. Adapted from (53).
Figure 9
Figure 9
Effects of a unilateral spinal cord lesion on the functional connectivity of intra-slice seed ROIs. (A and B) The 2D matrix plots of the mean correlation coefficients (r-values) among all five intra-slice ROI pairs in below (A) and above (B) lesion slices in one representative animal (SM-P). The color bar indicates the range of r-values. (C, 1) Coronal MTC image shows the actual lesion (black hole) detected at the 24-week post-lesion time point. Red rectangle outline shows the placement of the third axial image slice, which is centered at the lesion level. (C, 2) CTB stain of the corresponding postmortem spinal cord obtained at 24 weeks after the lesion. Zoomed-in image (left) shows the CTB terminals of the afferent entering zone for D5 and D3. (C, 3) The reconstructed lesion on the axial plane of the spinal cord in monkey SM-P. Black rectangle outline shows the location of the coronal MRI image shown in 2. (D and E) Whisker box plots of the correlation coefficients between horn-horn ROI (columns 1–4) and horn–control (white matter) ROI pairs (columns 5–6) at the imaging slices below lesion (slices 5 and 6) and above lesion (slices 1 and 2), respectively. Green lines separate the horn–horn and horn–control ROI pair groups. (F) Direct comparison of the mean correlation coefficients of the same set of ROI pairs obtained before (prelesion, green line) and after (postlesion, yellow line) the lesions. Error bars indicate the SD of the measurements. Datasets of 10 runs from two monkeys with spinal cord lesion acquired within 2–24 weeks postlesion were included in this analysis. (G) Whisker box plot of the correlation coefficients between dorsal-dorsal horns in below-lesion slices as a function of postlesion time point (in weeks) in two injured monkeys. Adapted from (53).
Figure 10
Figure 10
(A) T1-weighted anatomical image accompanied by enlarged spatio-temporal correlation tensor maps in the blue and yellow regions. Green arrows on tensor maps point to grey matter isotropic tensors, while red arrows point to white matter anisotropic tensors (B). Histograms of fractional anisotropy values for the tensors in the slice, as well as for the whole brain presented in (A). ** p < 0.0005 (Mann–Whitney Test). Adapted from (74).

References

    1. Biswal B, Yetkin FZ, Haughton VM, Hyde JS. Functional connectivity in the motor cortex of resting human brain using echo-planar MRI. Magn Reson Med. 1995;34(4):537–41. - PubMed
    1. Greicius MD, Krasnow B, Reiss AL, Menon V. Functional connectivity in the resting brain: a network analysis of the default mode hypothesis. Proc Natl Acad Sci U S A. 2003;100(1):253–8. - PMC - PubMed
    1. Guye M, Bartolomei F, Ranjeva JP. Imaging structural and functional connectivity: towards a unified definition of human brain organization? Curr Opin Neurol. 2008;21(4):393–403. - PubMed
    1. Hampson M, Driesen NR, Skudlarski P, Gore JC, Constable RT. Brain connectivity related to working memory performance. J Neurosci. 2006;26(51):13338–43. - PMC - PubMed
    1. Newton AT, Morgan VL, Gore JC. Task demand modulation of steady-state functional connectivity to primary motor cortex. Hum Brain Mapp. 2007;28(7):663–72. - PMC - PubMed