Review
. 2017 Mar 1;423(1):1-11.
doi: 10.1016/j.ydbio.2017.01.023. Epub 2017 Feb 2.

eMouseAtlas: An atlas-based resource for understanding mammalian embryogenesis

Affiliations
Review

eMouseAtlas: An atlas-based resource for understanding mammalian embryogenesis

Chris Armit et al. Dev Biol. .

Abstract

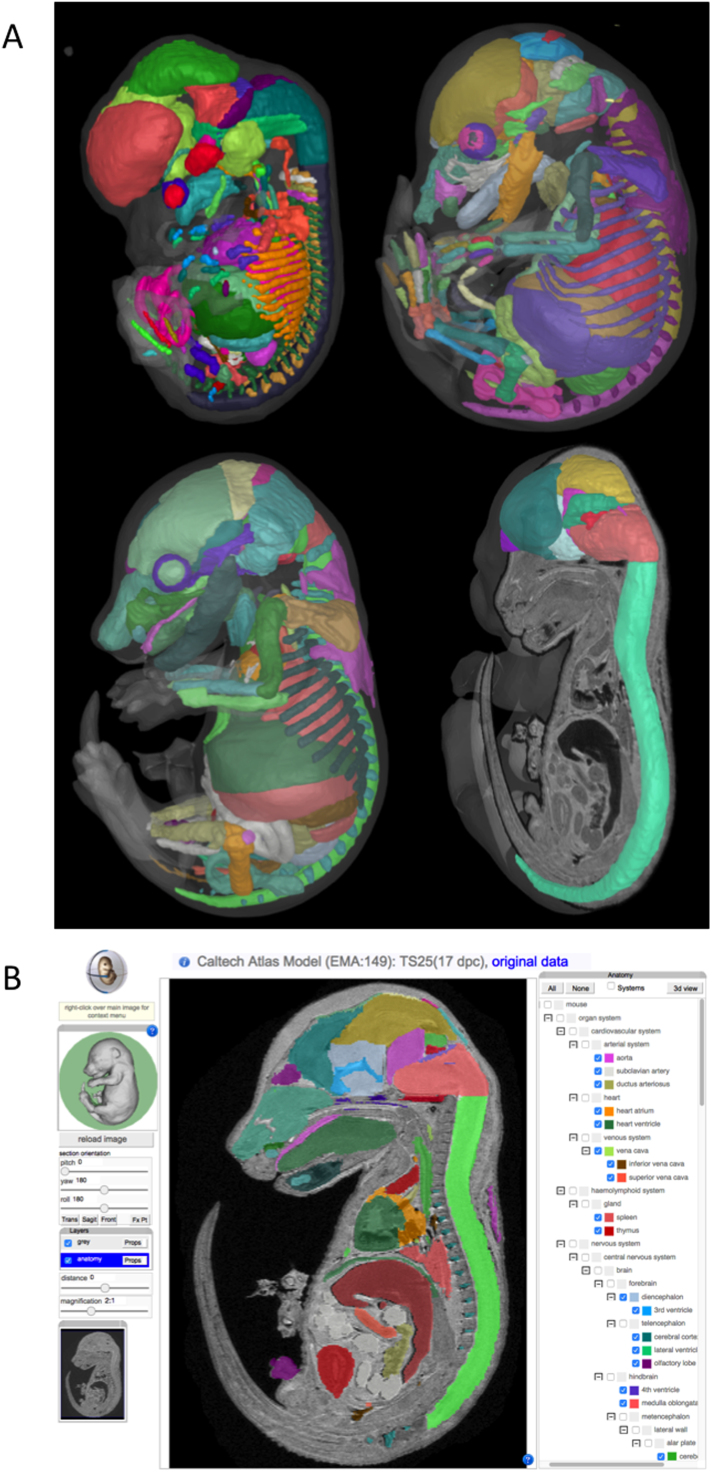
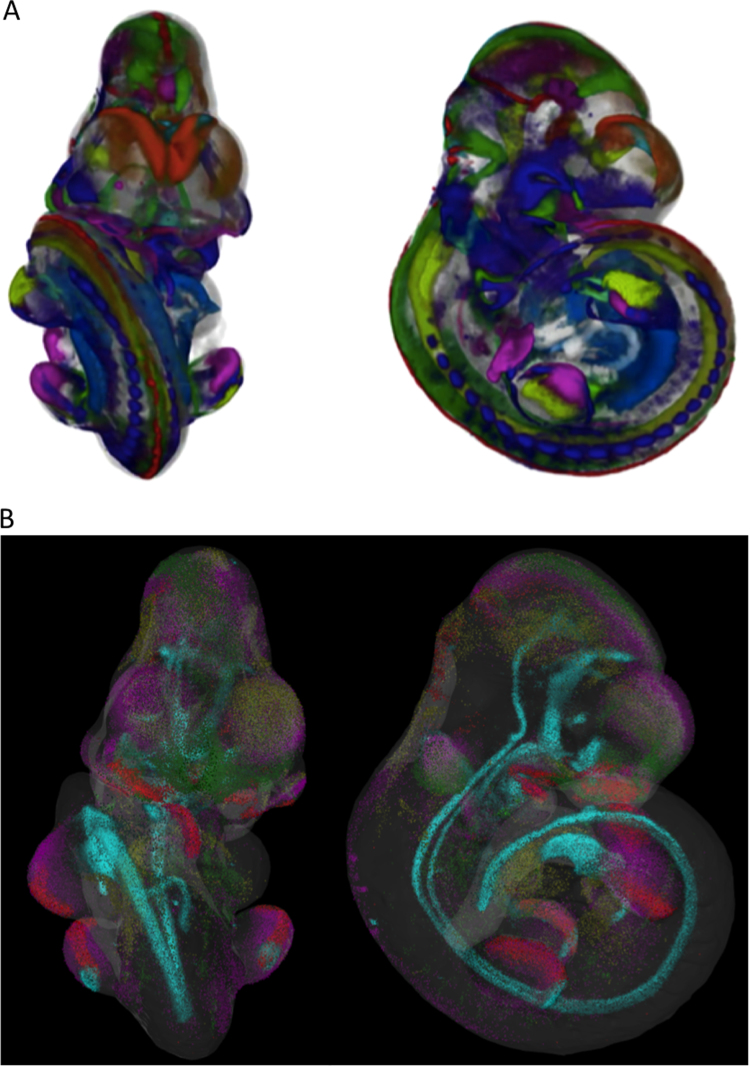
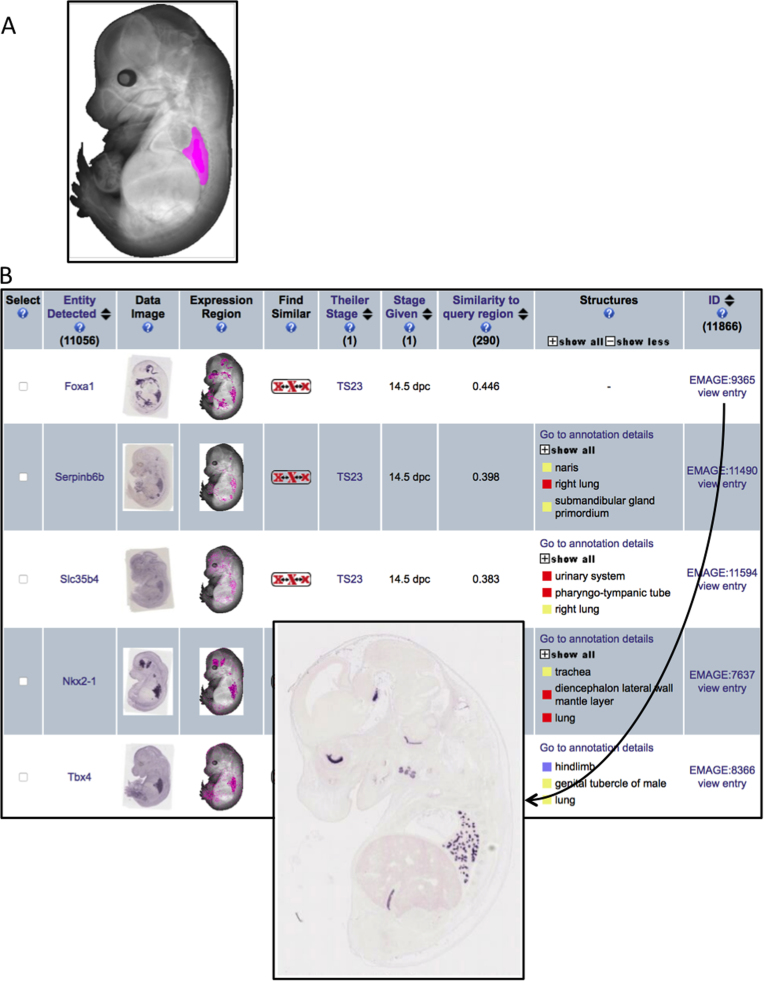
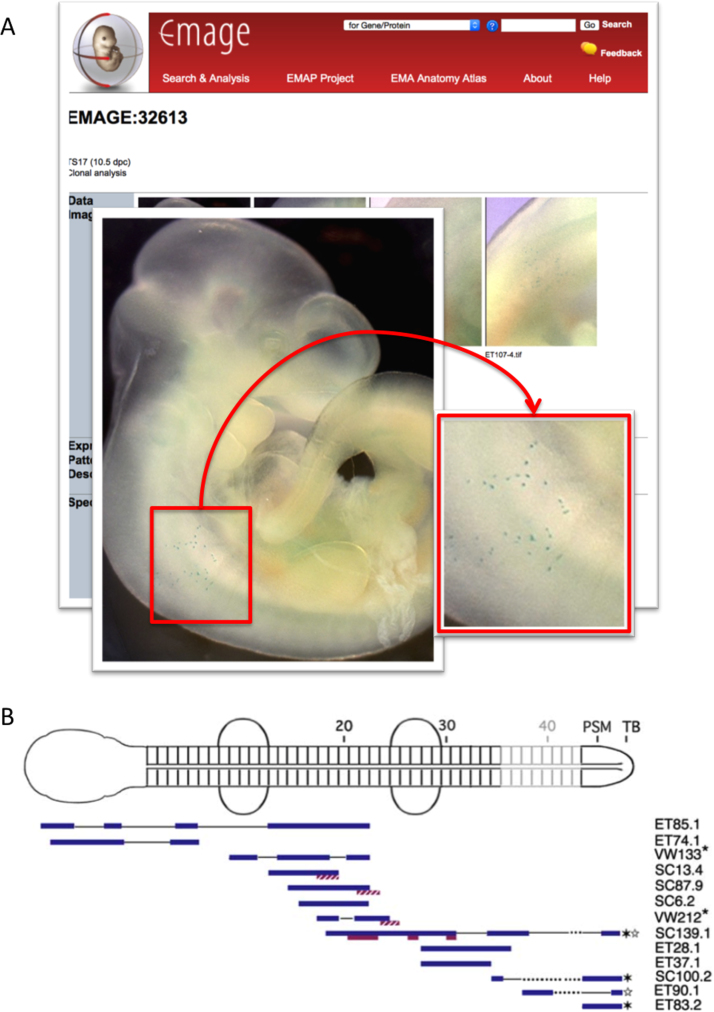
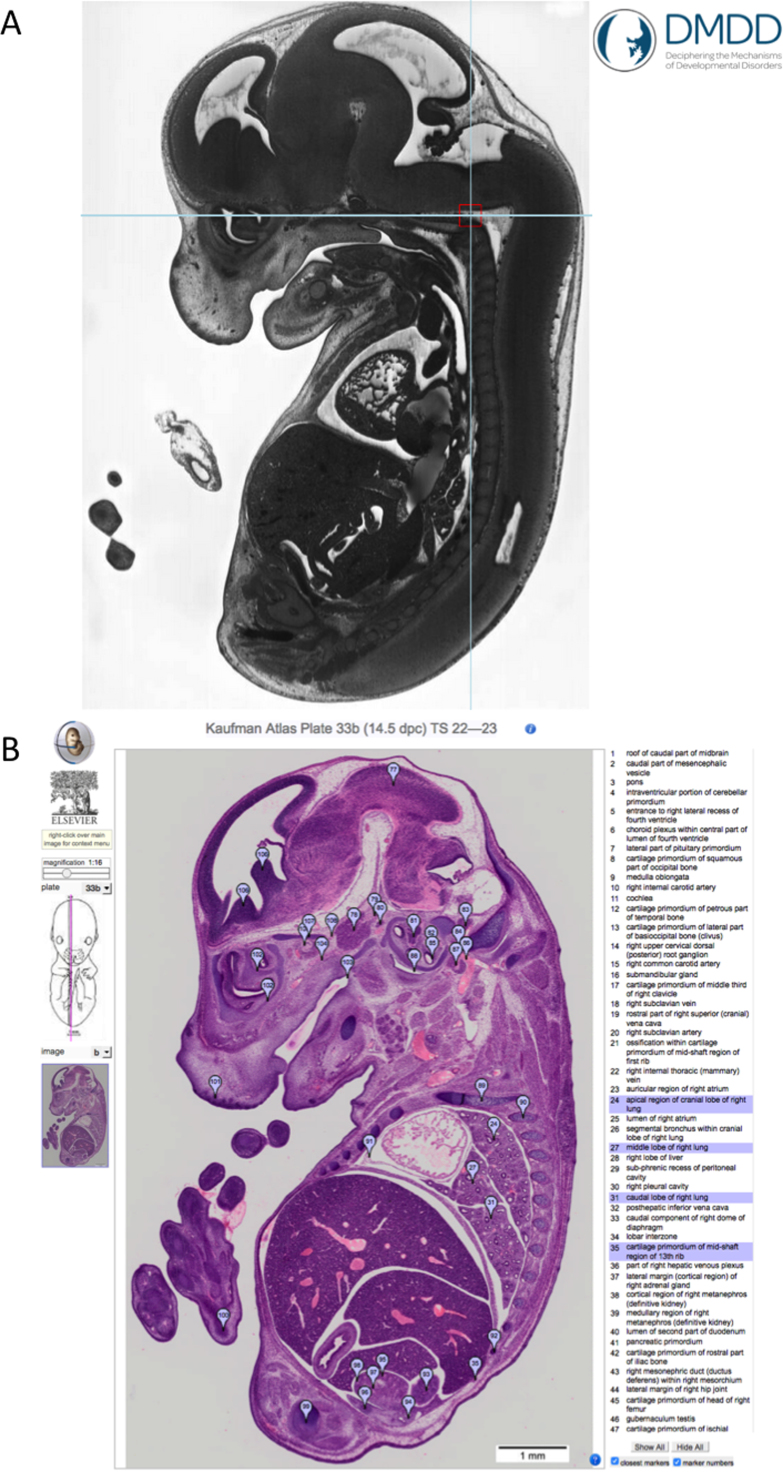
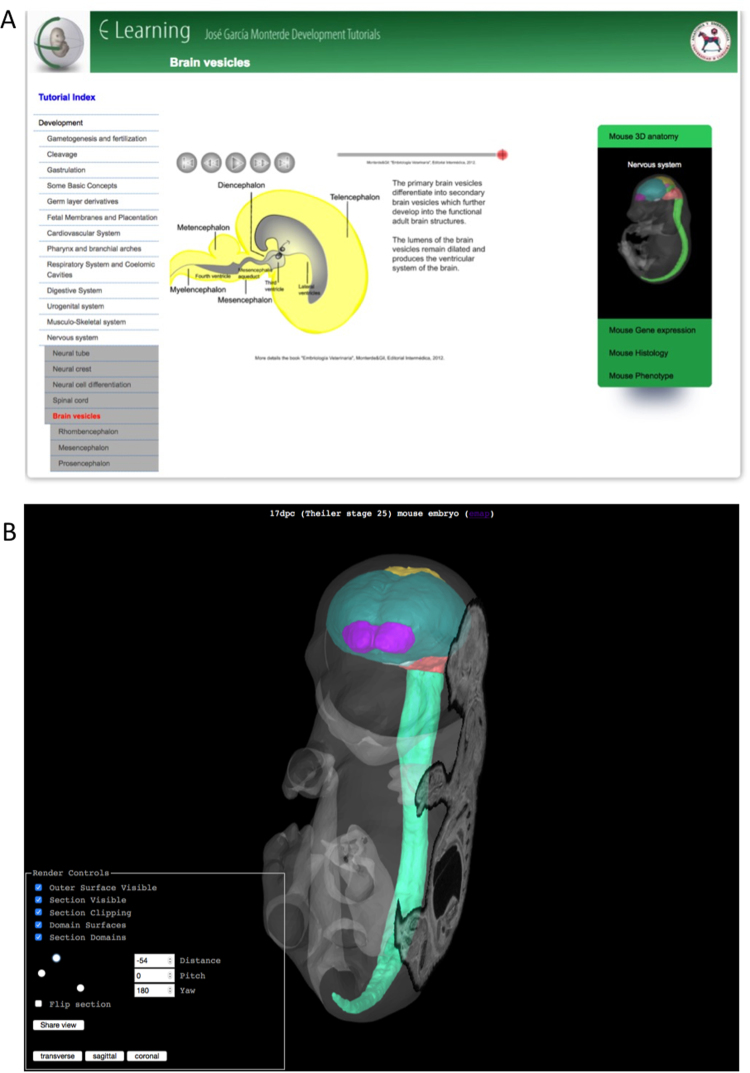
The eMouseAtlas resource is an online database of 3D digital models of mouse development, an ontology of mouse embryo anatomy and a gene-expression database with about 30K spatially mapped gene-expression patterns. It is closely linked with the MGI/GXD database at the Jackson Laboratory and holds links to almost all available image-based gene-expression data for the mouse embryo. In this resource article we describe the novel web-based tools we have developed for 3D visualisation of embryo anatomy and gene expression. We show how mapping of gene expression data onto spatial models delivers a framework for capturing gene expression that enhances our understanding of development, and we review the exploratory tools utilised by the EMAGE gene expression database as a means of defining co-expression of in situ hybridisation, immunohistochemistry, and lacZ-omic expression patterns. We report on recent developments of the eHistology atlas and our use of web-services to support embedding of the online 'The Atlas of Mouse Development' in the context of other resources such as the DMDD mouse phenotype database. In addition, we discuss new developments including a cellular-resolution placental atlas, third-party atlas models, clonal analysis data and a new interactive eLearning resource for developmental processes.


Figures

Fig. 1
Fig. 1
3D atlas models visualised using the eMouseAtlas 3D atlas viewer. A) Surface-rendered views of Theiler stage 21 (top left), Theiler stage 24 (top right), and Theiler stage 25 (lower left and right) mouse embryo models with delineated anatomy can be interactively explored using a web browser. B) The eMouseAtlas IIP3D section viewer allows users to define an arbitrary section through a 3D volume using a web browser. Navigation controls are provided in the left panel and include: pan-and-zoom; translating the viewing plane (distance); and rotating the viewing plane in 3 dimensions (pitch, yaw). The central panel shows a section through a 3D model with delineated anatomy shown in various colours. An anatomy tree in the right panel is used to visualise delineated anatomical domains. Clicking on 3D view (top right) opens up the selected anatomical domains as a surface rendered object in a separate window.
Fig. 2
Fig. 2
3D visualisation of molecular anatomy. A) Volume rendered views of 19 E10.5 (TS17) spatially mapped Wnt family gene expression patterns can be generated using commercially available software packages such as Amira. These visualisations can be used to cross-compare gene expression patterns in a spatial framework. B) Point-cloud rendered views of spatially mapped E10.5 (TS17) Shh (cyan), Fgf8 (red), Fgf9 (green), Fgf10 (magenta), and Fgf20 (yellow) enable direct visualisation of spatially mapped gene expression patterns in the context of a web browser and without the need for data download. An advantage of the point cloud visualisation is that a user can see through the entire 3D volume, and can more accurately identify regions of expression. An interactive point cloud visualisation can be found at the following link: http://aberlour.hgu.mrc.ac.uk/MARenderTests/genexpr-shh+fgf.html.
Fig. 3
Fig. 3
EMAGE Spatial Query. A use case scenario in which an EMAGE spatial query is used to identify gene expression patterns in the developing lung. A) A user-defined region (pink) on an embryo model is delineated using the Embryo Space paint query tool. B) A results table returns a list of EMAGE entries ranked by spatial similarity to the defined region of interest. The gene symbol (entity detected), spatial annotation (expression region), text annotation (structures), and similarity score (similarity to query region) are all shown in the results table. High-resolution original images (inset) and probe details are found on the EMAGE entry page, which can be accessed by clicking on the EMAGE entry ID in the results table. This example query identified Foxa1, Serpin6b, Slc35b4, Nkx2-1, and Tbx4 as the top 5 genes that show spatially mapped expression in the E14.5 (TS23) lung. The first gene in this list, Foxa1, was not text-annotated by the authors but was spatially mapped by the EMAGE Editorial Office and so could be retrieved by spatial query.
Fig. 4
Fig. 4
A spatial model for capturing clonal analysis data. A) Clonal analysis data is hosted by the EMAGE database. These entries include text-annotation provided by the original authors. B) Clonal analysis maps used by the authors as part of their annotation process can additionally be incorporated into EMAGE entries and used to capture clone distribution. Reprinted from Fig. S4 in Developmental Cell 17, Tzouanacou et al., Redefining the progression of lineage segregations during mammalian embryogenesis by clonal analysis, 365-76, Copyright (2009), with permission from Elsevier.
Fig. 5
Fig. 5
eHistology and phenotyping. eHistology supports the DMDD phenotyping effort by providing detailed annotation to accompany phenotype image data. A) The DMDD web resource hosts high-resolution episcopic microscopy (HREM) volumetric images of E14.5 knockout mouse embryos. In this example, the cross-hairs define the region of a vascular abnormality in a Fam46-/- mouse embryo specimen (DMDD5400). The DMDD consortium have labelled this phenotype as an ‘additional anastomosis between intracranial vertebral arteries’. B) The supporting eHistology image for the section plane shown in A) highlights multiple anatomical components that researchers should additionally consider when evaluating phenotype image data. The web tool we have delivered enables image matching between DMDD and eHistology resources, such that for any given section through a DMDD image volume the closest match from the eHistology (Kaufman) atlas can be retrieved.
Fig. 6
Fig. 6
eLearning. eLearning combines animations that enable conceptual understanding of key principles of embryonic development with 3D visualisations of embryo anatomy. A) An animated tutorial is presented in the central panel. The accordion selection tool to the right of the page links to accompanying 3D visualisations. There are additional tabs in the accordion selection tool that link to: EMAGE gene expression patterns associated with developing organ systems; the cellular-resolution eHistology atlas; and DMDD (DMDD.org.uk) phenotype queries. B) The eLearning 3D viewer shows a 3D surface reconstruction of an embryo model, combined with a section through the 3D volume. In this example, the developing nervous system is delineated. By doing so, this viewer enables the detail provided on section to be shown in the context of the 3D anatomy. The navigation tools allow a user to change the section plane. There are additional options to: view/hide the clipping plane through the surface reconstruction; view/hide the section plane through the volumetric image; view/hide the outer surface; view/hide the anatomical domains.

Similar articles

Cited by

References

    1. Armit C., Venkataraman S., Richardson L., Stevenson P., Moss J. eMouseAtlas, EMAGE, and the spatial dimension of the transcriptome. Mamm. Genome. 2012;23:514–524. - PMC - PubMed
    1. Armit C., Richardson L., Hill B., Yang Y., Baldock R. eMouseAtlas informatics: embryo atlas and gene expression database. Mamm. Genome. 2015;26:431–440. - PMC - PubMed
    1. Attwood T.K., Agit B., Ellis L.B.M. Longevity of biological databases. EMBnet J. 2015
    1. Baldock R., Bard J., Davidson D.R., Morriss-Kay G. Elsevier; 2015. Kaufman's Atlas of Mouse Development.
    1. Chen C.-K., Symmons O., Uslu V.V. TRACER: a resource to study the regulatory architecture of the mouse genome. BMC Genom. 2013;14:215. - PMC - PubMed

Publication types

LinkOut - more resources