

Immune-complex level of cofilin-1 in sera is associated with cancer progression and poor prognosis in pancreatic cancer
- PMID: 28161904
- PMCID: PMC5406537
- DOI: 10.1111/cas.13181
Immune-complex level of cofilin-1 in sera is associated with cancer progression and poor prognosis in pancreatic cancer
Abstract
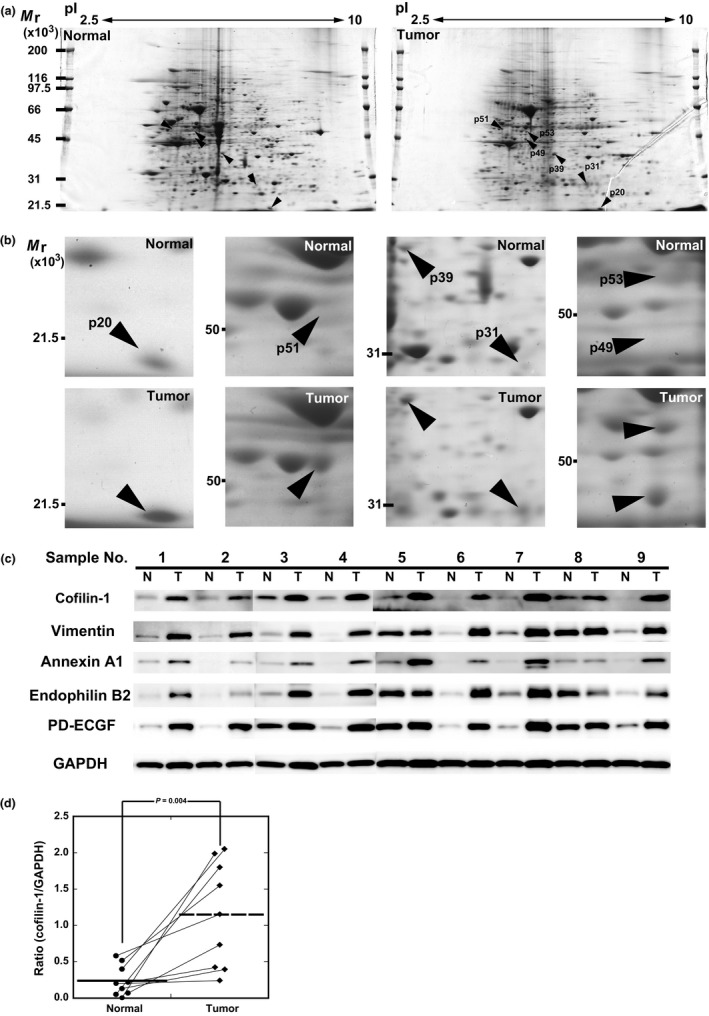
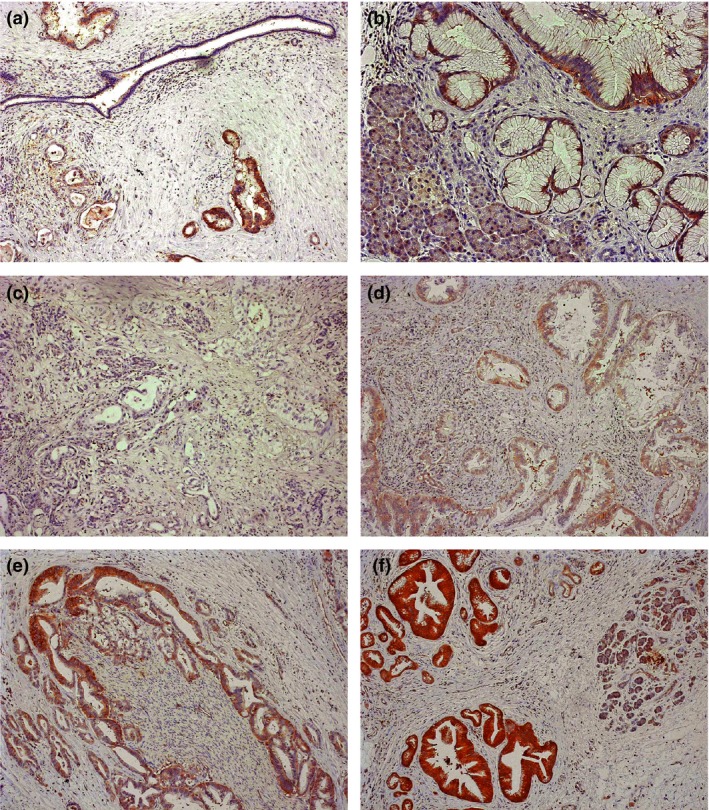
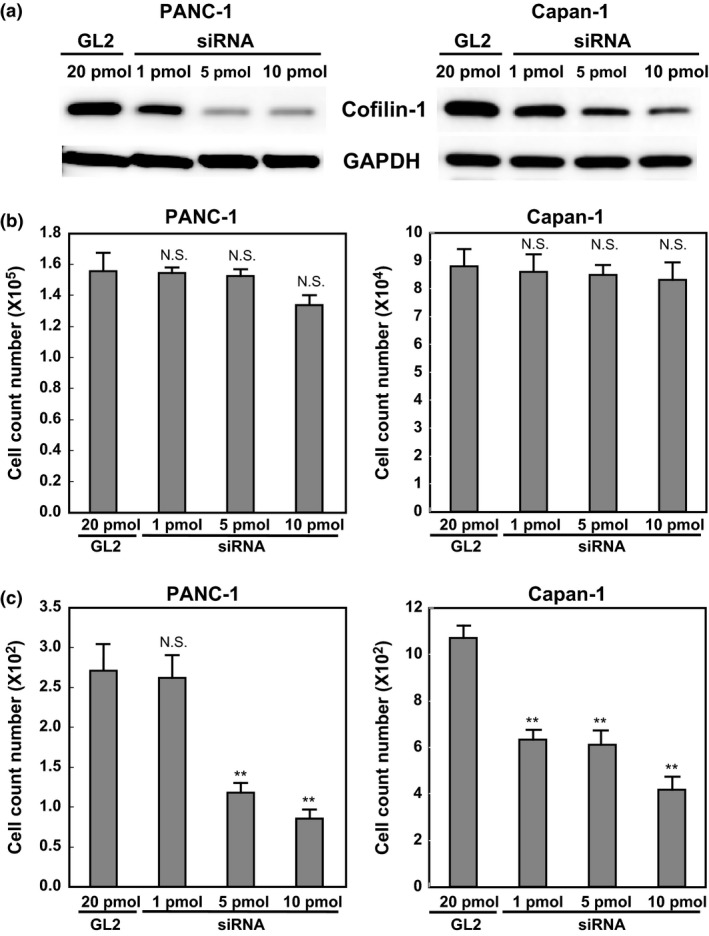
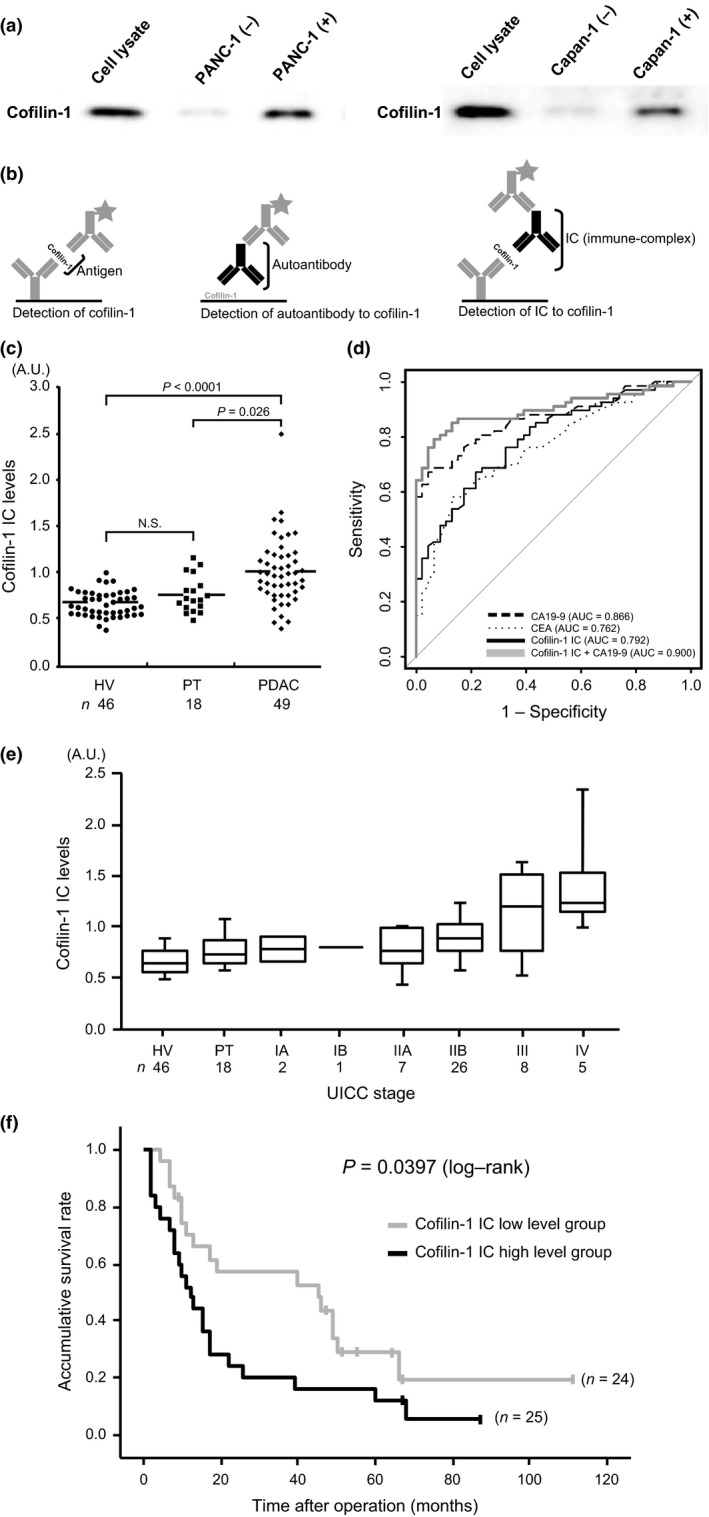
Pancreatic ductal adenocarcinoma (PDAC) is one of the most lethal malignancies. To improve its outcome, reliable biomarkers are urgently needed. In this study, we aimed to elucidate the key molecules involved in PDAC progression using proteomics approaches. First, we undertook 2-D electrophoresis to identify the proteins overexpressed in PDAC tissues. Following the analysis of agarose gel spots, cofilin-1 was identified and verified as a candidate protein commonly upregulated in PDAC tissues. In immunohistochemistry, cofilin-1 was strongly expressed in the cytoplasm of PDAC cells. Samples were divided into two groups based on the level of cofilin-1 expression. The high expression group showed significantly higher incidence of hematogenous dissemination in relapsed patients than the low expression group (P = 0.0083). In in vitro experiments, knockdown of cofilin-1 significantly decreased chemotaxis in PDAC cell lines. After we confirmed that cofilin-1 was secreted from PDAC cells, we established a detection system for the immune-complex of cofilin-1 in sera. Using this system, we measured the IC levels of cofilin-1 in sera and observed that the IC levels of cofilin-1 in PDAC patients were higher than those in healthy volunteers and patients with pancreatitis (PDAC vs. healthy volunteers, P < 0.0001; PDAC vs. patients with pancreatitis, P < 0.026). Notably, the IC levels of cofilin-1 showed a stepwise increase during PDAC progression (P = 0.0034), and high IC levels of cofilin-1 indicated poor prognosis of patients after surgery (P = 0.039). These results suggest that the IC of cofilin-1 in sera is a potentially attractive serum biomarker for the prognosis of PDAC.
Keywords: Cofilin-1; immune-complex; pancreatic cancer; prognosis; serum biomarker.
© 2017 The Authors. Cancer Science published by John Wiley & Sons Australia, Ltd on behalf of Japanese Cancer Association.
Figures
Similar articles
-
Prognostic Significance of Cofilin Isoforms in Patients With Pancreatic Ductal Adenocarcinoma.Pathol Oncol Res. 2021 May 10;27:1609821. doi: 10.3389/pore.2021.1609821. eCollection 2021. Pathol Oncol Res. 2021. PMID: 34257623 Free PMC article. No abstract available.
-
Linc00675 is a novel marker of short survival and recurrence in patients with pancreatic ductal adenocarcinoma.World J Gastroenterol. 2015 Aug 21;21(31):9348-57. doi: 10.3748/wjg.v21.i31.9348. World J Gastroenterol. 2015. PMID: 26309360 Free PMC article.
-
Proteomic analysis identifies MMP-9, DJ-1 and A1BG as overexpressed proteins in pancreatic juice from pancreatic ductal adenocarcinoma patients.BMC Cancer. 2008 Aug 16;8:241. doi: 10.1186/1471-2407-8-241. BMC Cancer. 2008. PMID: 18706098 Free PMC article.
-
Application of Proteomics in Pancreatic Ductal Adenocarcinoma Biomarker Investigations: A Review.Int J Mol Sci. 2022 Feb 14;23(4):2093. doi: 10.3390/ijms23042093. Int J Mol Sci. 2022. PMID: 35216204 Free PMC article. Review.
-
The next "sweet" spot for pancreatic ductal adenocarcinoma: Glycoprotein for early detection.Mass Spectrom Rev. 2023 Mar;42(2):822-843. doi: 10.1002/mas.21748. Epub 2021 Nov 12. Mass Spectrom Rev. 2023. PMID: 34766650 Free PMC article. Review.
Cited by
-
Cofilin: A Promising Protein Implicated in Cancer Metastasis and Apoptosis.Front Cell Dev Biol. 2021 Feb 4;9:599065. doi: 10.3389/fcell.2021.599065. eCollection 2021. Front Cell Dev Biol. 2021. PMID: 33614640 Free PMC article. Review.
-
Cofilin(s) and Mitochondria: Function Beyond Actin Dynamics.Int J Mol Sci. 2025 Apr 25;26(9):4094. doi: 10.3390/ijms26094094. Int J Mol Sci. 2025. PMID: 40362336 Free PMC article. Review.
-
Antibody Diversity in Cancer: Translational Implications and Beyond.Vaccines (Basel). 2022 Jul 22;10(8):1165. doi: 10.3390/vaccines10081165. Vaccines (Basel). 2022. PMID: 35893814 Free PMC article. Review.
-
Proteomic Signatures of the Serological Response to Influenza Vaccination in a Large Human Cohort Study.Viruses. 2022 Nov 9;14(11):2479. doi: 10.3390/v14112479. Viruses. 2022. PMID: 36366577 Free PMC article.
-
The Mutant p53-Driven Secretome Has Oncogenic Functions in Pancreatic Ductal Adenocarcinoma Cells.Biomolecules. 2020 Jun 9;10(6):884. doi: 10.3390/biom10060884. Biomolecules. 2020. PMID: 32526853 Free PMC article.
References
-
- Miller KD, Siegel RL, Lin CC et al Cancer treatment and survivorship statistics, 2016. CA Cancer J Clin 2016; 66: 271–89. - PubMed
-
- de Gramont A, Watson S, Ellis LM et al Pragmatic issues in biomarker evaluation for targeted therapies in cancer. Nat Rev Clin Oncol 2015; 12: 197–212. - PubMed
-
- Takano S, Yoshitomi H, Togawa A et al Apolipoprotein C‐1 maintains cell survival by preventing from apoptosis in pancreatic cancer cells. Oncogene 2008; 27: 2810–22. - PubMed
-
- Beneduce L, Prayer‐Galetti T, Giustinian AM et al Detection of prostate‐specific antigen coupled to immunoglobulin M in prostate cancer patients. Cancer Detect Prev 2007; 31: 402–7. - PubMed
MeSH terms
Substances
LinkOut - more resources
Full Text Sources
Other Literature Sources
Medical
