. 2017 Feb 23;168(5):890-903.e15.
doi: 10.1016/j.cell.2017.01.013. Epub 2017 Feb 2.

Gene Essentiality Profiling Reveals Gene Networks and Synthetic Lethal Interactions with Oncogenic Ras

Affiliations

Gene Essentiality Profiling Reveals Gene Networks and Synthetic Lethal Interactions with Oncogenic Ras

Tim Wang et al. Cell. .

Abstract

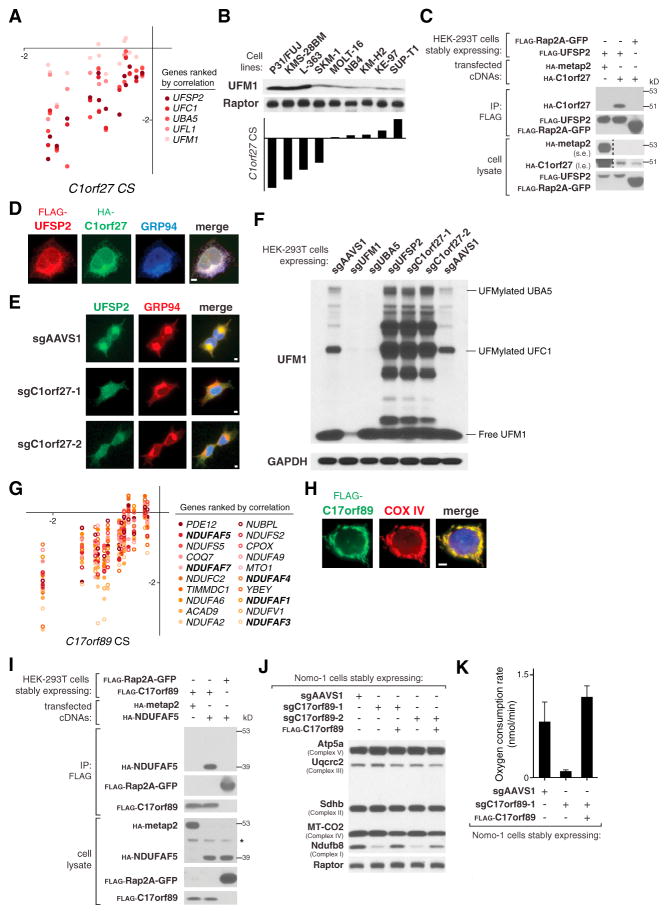
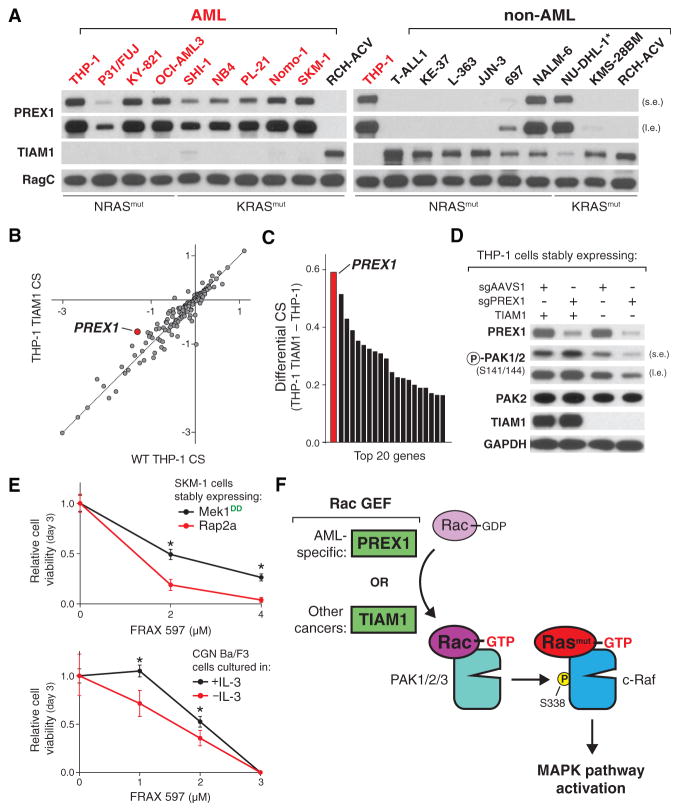
The genetic dependencies of human cancers widely vary. Here, we catalog this heterogeneity and use it to identify functional gene interactions and genotype-dependent liabilities in cancer. By using genome-wide CRISPR-based screens, we generate a gene essentiality dataset across 14 human acute myeloid leukemia (AML) cell lines. Sets of genes with correlated patterns of essentiality across the lines reveal new gene relationships, the essential substrates of enzymes, and the molecular functions of uncharacterized proteins. Comparisons of differentially essential genes between Ras-dependent and -independent lines uncover synthetic lethal partners of oncogenic Ras. Screens in both human AML and engineered mouse pro-B cells converge on a surprisingly small number of genes in the Ras processing and MAPK pathways and pinpoint PREX1 as an AML-specific activator of MAPK signaling. Our findings suggest general strategies for defining mammalian gene networks and synthetic lethal interactions by exploiting the natural genetic and epigenetic diversity of human cancer cells.

Keywords: AML; CRISPR; RAS; gene networks; genetic screens; synthetic lethality.


Figures

Figure 1
Figure 1. Genome-wide CRISPR Screens for Cell-Essential Genes
(A) Pooled CRISPR-based screening strategy. (B) CS correlation between cell lines and replicate screens of NB4. (C) Common cell-essential genes are involved in fundamental biological processes. Gene set enrichment analysis was performed on genes ranked by average CS. (D–F) SWS analysis. (D) High SWS peaks in HEL that (E) correspond to regions of genomic amplification. (F) Contiguous region of low CS genes reside in amplicon on chromosome 9p24 containing the JAK2 oncogene. See also Figure S1 and Tables S1, S2, S3.
Figure 2
Figure 2. Correlated Gene Essentiality across Cell Lines Uncovers Functional Gene Relationships
(A) Strategy for identifying functionally related sets of genes. (B–F) Correlated essentiality of genes encoding (B) obligate heterodimers, (C) members of complexes in the mTOR pathway, (D) components of the Fanconi anemia DNA repair pathway, (E) enzymes catalyzing successive metabolic reactions, and (F) negative regulators of p53 that are negatively correlated with TP53 essentiality. r, Pearson’s correlation coefficient. (G) Top: FURIN protease shows correlated essentiality with its substrate IGF1R and the IRS2 signaling adaptor. Bottom: the transcription factor Nrf-1 (encoded by NFE2L1) shows correlated essentiality with the NGLY1 deglycosylase and DDI2 peptidase. (H) Correlated essentiality of two sets of genes with no known relationship. See also Figure S2 and Tables S1, S2, S3, S6, S7, and S8.
Figure 3
Figure 3. Correlated Essentiality Analysis Reveals Function of Two Uncharacterized Genes
(A) Correlated essentiality of C1orf27 with members of the UFMylation pathway. (B) UFM1 levels correlate with C1orf27 essentiality. (C) Recombinant C1orf27 and UFSP2 interact. Rap2A and metap2 served as control bait and prey proteins. s.e., short exposure. l.e., long exposure. (D) Micrograph of a HEK293T cell stably expressing FLAG-UFSP2 and HA-C1orf27. GRP94 is an ER marker. (E) C1orf27 is required for the proper localization of UFSP2 in HEK293T cells. (F) C1orf27 loss results in accumulation of UFMylated proteins. GAPDH served as a loading control. (G) Correlated essentiality of C17orf89 with members of the OXPHOS pathway. (H) Micrograph of a HEK293T cell stably expressing FLAG-C17orf89. COX IV is a mitochondrial marker. (I) Recombinant C17orf89 and NDUFAF5 interact. *, non-specific band. (J and K) C17orf89 loss (J) destabilizes mitochondrial complex I and (K) reduces oxygen consumption. Raptor served as a loading control. Error bars represent SD from four replicate wells. Scale bar, 5 μm. See also Figure S3 and Tables S1, S2, S3.
Figure 4
Figure 4. Identification of Driver Oncogenes via an Integrative Genomic Approach
(A) Genomic information and gene essentiality data identify driver oncogenes. JAK2 is a known driver in HEL cells, but resides in an amplicon and cannot be assessed in our screen. (B) PDGFRA and RAF1 participate in oncogenic gene fusions. Only gene-fusion-targeting sgRNAs are depleted. (C) RNA sequencing of OCI-AML2 pinpoints a discontinuity in coverage between exons 4 and 5 of RAF1. PL-21 served as a control. (D) Immunoblotting using an antibody against the C terminus of c-Raf identifies a 90-kDa protein in OCI-AML2. Raptor served as a loading control. See also Figure S4 and Tables S1, S2, S3.
Figure 5
Figure 5. Two Independent Screening Approaches Identify Common Synthetic Lethal Interactions with Oncogenic Ras
(A) Left: differential gene essentiality analysis of 12 cytokine-independent AML cell lines. The three mutant NRAS and three mutant KRAS cell lines are dependent on the mutated Ras isoform. The open circle in RAF1 CS plot represents OCI-AML2. Right: Ba/F3 cells were transduced with (C)as9-(G)FP and (N)RASG13D to generate the CGN Ba/F3 line. CGN cells do not rely on JAK/STAT signaling and are conditionally dependent on the Ras pathway as assessed by sensitivity to the JAK and MEK inhibitors, ruxolitinib, and selumetinib. Comparisons between CGN cells cultured in the presence and absence of IL-3 reveals synthetic lethal interactions with oncogenic Ras. Error bars represent SD from six replicate wells. (B) SHOC2 loss reduced MAPK pathway activity in KRAS mutant SKM-1 cells, but not RAF1 mutant OCI-AML2 cells. GAPDH served as a loading control. (C) Ras synthetic lethal gene candidates converged on pathways functioning up- and downstream of Ras. See also Figure S5 and Tables S1, S2, S3, S4, and S5.
Figure 6
Figure 6. MAPK Pathway Activation Requires PREX1 in Mutant Ras AML Cells
(A) PREX1 is differentially essential between human AML cell lines with mutant and wild-type Ras. (B) Focused library screens in 42 human hematopoietic cancer cell lines. The mutant Ras, non-AML cell line in the PREX1 CS plot represented by the open circle is NU-DHL-1 (see Figure 7A). *p < 0.05, Welch’s t test. (C–F) Focused library screens in SKM-1 cells stably expressing (C and D) wild-type and constitutively active Rac1 (Rac1G12V) (E and F), wild-type, constitutively active Mek1 (Mek1DD), and the parental SKM-1 line. (G) Mek1 activation increases phospho-Erk1/2 levels. Rac1 activation results in increased phospho-PAK levels and MAPK pathway activity. SKM-1 Rap2A served as a negative control. Raptor and S6K1 were used as loading controls. (H and I) PREX1 knockdown reduces (H) active Rac1, (I) phospho-PAK, and MAPK pathway activity. Raptor and GAPDH served as loading controls. s.e., short exposure. l.e., long exposure. See also Figure S6 and Tables S1, S2, S3, S6, S7, and S8.
Figure 7
Figure 7. Lack of Paralog Expression Explains PREX1-Dependence in AML
(A) Analysis of PREX1 and TIAM1 expression. RagC was used as a loading control. (B) Focused library screens in wild-type and TIAM1-overexpressing THP-1 cells. (C) CRISPR scores from THP-1 TIAM1 cells are compared with those of the parental THP-1 cells to calculate the differential CS. (D) TIAM1 rescues sgPREX1-mediated inhibition of PAK signaling in THP-1 cells. GAPDH served as a loading control. (E) Treatment of isogenic SKM-1 and Ba/F3 cell line pairs with a group I PAK inhibitor FRAX-597. Error bars represent SD from ten replicate wells. *p < 0.05, Welch’s t test. (F) Proposed model of cell-type-specific PREX1 dependence. SE, short exposure; LE, long exposure. See also Tables S6, S7, and S8.

References

    1. Aguirre AJ, Meyers RM, Weir BA, Vazquez F, Zhang C-Z, Ben-David U, Cook A, Ha G, Harrington WF, Doshi MB, et al. Genomic copy number dictates a gene-independent cell response to CRISPR-Cas9 targeting. Cancer Disc. 2016 http://dx.doi.org/10.1158/2159-8290.CD-16-0154. - DOI - PMC - PubMed
    1. Ashworth A, Lord CJ, Reis-Filho JS. Genetic interactions in cancer progression and treatment. Cell. 2011;145:30–38. - PubMed
    1. Barbie DA, Tamayo P, Boehm JS, Kim SY, Moody SE, Dunn IF, Schinzel AC, Sandy P, Meylan E, Scholl C, et al. Systematic RNA interference reveals that oncogenic KRAS-driven cancers require TBK1. Nature. 2009;462:108–112. - PMC - PubMed
    1. Barretina J, Caponigro G, Stransky N, Venkatesan K, Margolin AA, Kim S, Wilson CJ, Lehár J, Kryukov GV, Sonkin D, et al. The Cancer Cell Line Encyclopedia enables predictive modelling of anticancer drug sensitivity. Nature. 2012;483:603–607. - PMC - PubMed
    1. Bassi DE, Fu J, Lopez de Cicco R, Klein-Szanto AJP. Pro-protein convertases: “master switches” in the regulation of tumor growth and progression. Mol Carcinog. 2005;44:151–161. - PubMed

Publication types